Given the following MRE, is it possible to access or print the number of elements resulting from the application of the CDSView filter on the ColumnDataSource in Bokeh? In this simple case, I’d like to get the information that 3 rows are returned and, if possible, access the index of ColumnDataSource.data of the filtered rows.
from bokeh.models import BooleanFilter, CDSView, ColumnDataSource
from bokeh.plotting import figure, show

source = ColumnDataSource(data=dict(x=[1, 2, 3, 4, 5], y=[1, 2, 3, 4, 5]))
booleansX = [True if x_val < 5 else False for x_val in source.data['x']]
booleansY = [True if y_val > 1 else False for y_val in source.data['y']]
view = CDSView(source=source, filters=[BooleanFilter(booleansX), BooleanFilter(booleansY)])

p_filtered = figure(height=300, width=300)
p_filtered.circle(x="x", y="y", size=10, source=source, view=view)

show(p_filtered)
Note that this MRE is not the actual real data, I am just hoping to get this insight to debug a code using much larger CDS.
This information is not currently publicly exposed anywhere. You could open a GitHub Issue to start a discussion to propose future work to make it available in some way. However, I should note that the final set of indices is only computed in the browser, so even if something was developed, the information would probably only be available on the JavaScript side, and not from Python.
Thanks Bryan. In this case I just wanted to test the sanity of a complex filter, but maybe I don’t (yet) fully grasp technical aspects of Bokeh. Thanks for the amazing work!
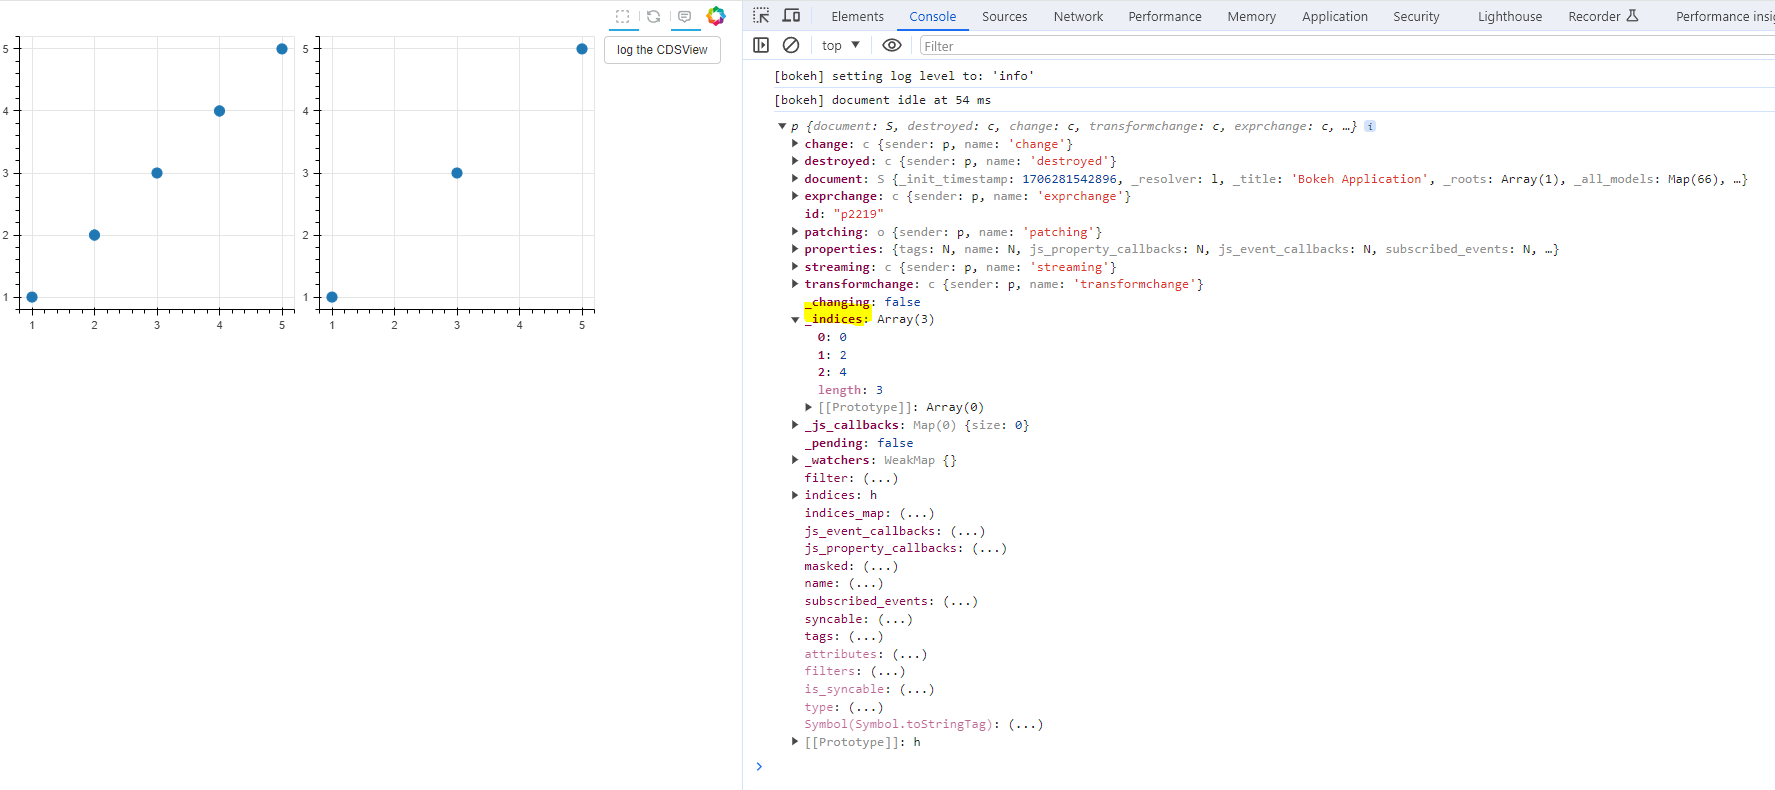
The CDSView on the browser side has an _indices attribute that will expose the computed indices for you. You could do this check on the browser side this way w some dummy CustomJS and a widget to trigger it: