Getting an exception when trying to change size in a plot - "unexpected attribute 'size' to Chart"

This relates to this Stack Overflow question.

I’m new to python, plotting, and bokeh, so I’m hoping I’m doing something wrong that is quite simple.

Something breaks when I try to change the size of plot markers on a scatter plot to reflect the value count of a column of data.

Here’s a link to the .py file. I removed any sensitive data (credentials), but kept everything else as is.

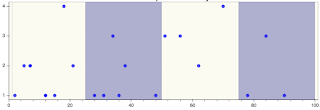
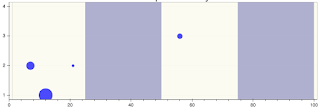
I was getting a successful plot (1st image, further down), but when I added the below to try and change the marker sizes it gets screwy (2nd image):

Variable for the frequency count of Control Form Groups (for scatter plot)

cfg_freq = data[‘cfg’].value_counts()*4

``

Changed the size:

Set up the plot points, including the Hover Tool

cr = wt_cfg_plot.scatter(WT_Number, CFG_Number, size=cfg_freq, fill_color=“blue”,
line_color=None, alpha=0.7, hover_fill_color=“firebrick”,
hover_line_color=None, hover_alpha=1)

``

The 1st Image. All is good so far. For this size=7

The 2nd image, with the new size applied. Shenanigans. At the bottom is the full error message. The linked .py file has the code as it was.

The full error message:

Traceback (most recent call last):

File “”, line 1, in
runfile(’/python_file’, wdir=’/working_directory’)

File “/Applications/anaconda/lib/python3.5/site-packages/spyderlib/widgets/externalshell/sitecustomize.py”, line 699, in runfile
execfile(filename, namespace)

File “/Applications/anaconda/lib/python3.5/site-packages/spyderlib/widgets/externalshell/sitecustomize.py”, line 88, in execfile
exec(compile(open(filename, ‘rb’).read(), filename, ‘exec’), namespace)

File “/python_file”, line 142, in
ylabel=‘Control Form Group’)

File “/Applications/anaconda/lib/python3.5/site-packages/bokeh/charts/builders/scatter_builder.py”, line 63, in Scatter
return create_and_build(ScatterBuilder, data, **kws)

File “/Applications/anaconda/lib/python3.5/site-packages/bokeh/charts/builder.py”, line 66, in create_and_build
chart = Chart(**chart_kws)

File “/Applications/anaconda/lib/python3.5/site-packages/bokeh/charts/chart.py”, line 125, in init
super(Chart, self).init(*args, **kwargs)

File “/Applications/anaconda/lib/python3.5/site-packages/bokeh/models/plots.py”, line 78, in init
super(Plot, self).init(**kwargs)

File “/Applications/anaconda/lib/python3.5/site-packages/bokeh/model.py”, line 77, in init
super(Model, self).init(**kwargs)

File “/Applications/anaconda/lib/python3.5/site-packages/bokeh/core/properties.py”, line 701, in init
setattr(self, name, value)

File “/Applications/anaconda/lib/python3.5/site-packages/bokeh/core/properties.py”, line 722, in setattr
(name, self.class.name, text, nice_join(matches)))

AttributeError: unexpected attribute ‘size’ to Chart, possible attributes are above, background_fill_alpha, background_fill_color, below, border_fill_alpha, border_fill_color, disabled, extra_x_ranges, extra_y_ranges, h_symmetry, height, hidpi, left, legend, lod_factor, lod_interval, lod_threshold, lod_timeout, logo, min_border, min_border_bottom, min_border_left, min_border_right, min_border_top, name, outline_line_alpha, outline_line_cap, outline_line_color, outline_line_dash, outline_line_dash_offset, outline_line_join, outline_line_width, plot_height, plot_width, renderers, responsive, right, tags, title, title_standoff, title_text_align, title_text_alpha, title_text_baseline, title_text_color, title_text_font, title_text_font_size, title_text_font_style, tool_events, toolbar_location, tools, v_symmetry, webgl, width, x_mapper_type, x_range, xgrid, xlabel, xscale, y_mapper_type, y_range, ygrid, ylabel or yscale

``

I’ll finish this by saying that I have no idea how to successfully change the marker sizes by value in any other package. This is all pretty much the first time I’m doing any of it, I’m learning as I go!
Hi,

The error you are getting doesn’t seem related related to the parts posted here at all. My best blind guess is that it’s bein raised due to an unused code in tail of your script where you create a High Level Scatter Chart.

As for the weirdness related to the size of the scatter points, I think it’s related to this call:

`

Variable for the frequency count of Control Form Groups (for scatter plot)

cfg_freq = data[‘cfg’].value_counts()*4`

···

because cfg_freq (that you are using for size) length differs from the other series (WT_Number, CFG_Number) you are using to create the xs and ys (unless you only have unique values…) . value_counts() returns the counts for unique values on data[‘cfg’]… What strikes me is that you should have at least a warning at the consule telling about the length difference…

As a first step to try to make it happen I’d suggest you to have something like:

cfg_freq = data[‘cfg’]

and check if that works… If it works then you can create a function that actually takes data[‘cfg’] and returns a list of N values to express your size logic, so you can use it on the wt_cfg_plot.scatter call

Hope that helps

Fabio

On Thu, May 5, 2016 at 9:49 AM, Daniel Morgan [email protected] wrote:

This relates to this Stack Overflow question.

I’m new to python, plotting, and bokeh, so I’m hoping I’m doing something wrong that is quite simple.

Something breaks when I try to change the size of plot markers on a scatter plot to reflect the value count of a column of data.

Here’s a link to the .py file. I removed any sensitive data (credentials), but kept everything else as is.

I was getting a successful plot (1st image, further down), but when I added the below to try and change the marker sizes it gets screwy (2nd image):

Variable for the frequency count of Control Form Groups (for scatter plot)

cfg_freq = data[‘cfg’].value_counts()*4

``

Changed the size:

Set up the plot points, including the Hover Tool

cr = wt_cfg_plot.scatter(WT_Number, CFG_Number, size=cfg_freq, fill_color=“blue”,
line_color=None, alpha=0.7, hover_fill_color=“firebrick”,
hover_line_color=None, hover_alpha=1)

``

The 1st Image. All is good so far. For this size=7

The 2nd image, with the new size applied. Shenanigans. At the bottom is the full error message. The linked .py file has the code as it was.

The full error message:

Traceback (most recent call last):

File “”, line 1, in
runfile(‘/python_file’, wdir=‘/working_directory’)

File “/Applications/anaconda/lib/python3.5/site-packages/spyderlib/widgets/externalshell/sitecustomize.py”, line 699, in runfile
execfile(filename, namespace)

File “/Applications/anaconda/lib/python3.5/site-packages/spyderlib/widgets/externalshell/sitecustomize.py”, line 88, in execfile
exec(compile(open(filename, ‘rb’).read(), filename, ‘exec’), namespace)

File “/python_file”, line 142, in
ylabel=‘Control Form Group’)

File “/Applications/anaconda/lib/python3.5/site-packages/bokeh/charts/builders/scatter_builder.py”, line 63, in Scatter
return create_and_build(ScatterBuilder, data, **kws)

File “/Applications/anaconda/lib/python3.5/site-packages/bokeh/charts/builder.py”, line 66, in create_and_build
chart = Chart(**chart_kws)

File “/Applications/anaconda/lib/python3.5/site-packages/bokeh/charts/chart.py”, line 125, in init
super(Chart, self).init(*args, **kwargs)

File “/Applications/anaconda/lib/python3.5/site-packages/bokeh/models/plots.py”, line 78, in init
super(Plot, self).init(**kwargs)

File “/Applications/anaconda/lib/python3.5/site-packages/bokeh/model.py”, line 77, in init
super(Model, self).init(**kwargs)

File “/Applications/anaconda/lib/python3.5/site-packages/bokeh/core/properties.py”, line 701, in init
setattr(self, name, value)

File “/Applications/anaconda/lib/python3.5/site-packages/bokeh/core/properties.py”, line 722, in setattr
(name, self.class.name, text, nice_join(matches)))

AttributeError: unexpected attribute ‘size’ to Chart, possible attributes are above, background_fill_alpha, background_fill_color, below, border_fill_alpha, border_fill_color, disabled, extra_x_ranges, extra_y_ranges, h_symmetry, height, hidpi, left, legend, lod_factor, lod_interval, lod_threshold, lod_timeout, logo, min_border, min_border_bottom, min_border_left, min_border_right, min_border_top, name, outline_line_alpha, outline_line_cap, outline_line_color, outline_line_dash, outline_line_dash_offset, outline_line_join, outline_line_width, plot_height, plot_width, renderers, responsive, right, tags, title, title_standoff, title_text_align, title_text_alpha, title_text_baseline, title_text_color, title_text_font, title_text_font_size, title_text_font_style, tool_events, toolbar_location, tools, v_symmetry, webgl, width, x_mapper_type, x_range, xgrid, xlabel, xscale, y_mapper_type, y_range, ygrid, ylabel or yscale

``

I’ll finish this by saying that I have no idea how to successfully change the marker sizes by value in any other package. This is all pretty much the first time I’m doing any of it, I’m learning as I go!

You received this message because you are subscribed to the Google Groups “Bokeh Discussion - Public” group.

To unsubscribe from this group and stop receiving emails from it, send an email to [email protected].

To post to this group, send email to [email protected].

To view this discussion on the web visit https://groups.google.com/a/continuum.io/d/msgid/bokeh/759f01ad-dc38-47d0-b6cf-9b78a1adb111%40continuum.io.

For more options, visit https://groups.google.com/a/continuum.io/d/optout.

Fabio Pliger

Senior Software Engineer, Bokeh

Wow, changing it to:

cfg_freq = data[‘cfg’]

Worked.

You, Sir, are some sort of mystical wizard. Thanks so much!

···

On Thursday, May 5, 2016 at 8:44:17 PM UTC+2, Fabio Pliger wrote:

Hi,

The error you are getting doesn’t seem related related to the parts posted here at all. My best blind guess is that it’s bein raised due to an unused code in tail of your script where you create a High Level Scatter Chart.

As for the weirdness related to the size of the scatter points, I think it’s related to this call:

`

Variable for the frequency count of Control Form Groups (for scatter plot)

cfg_freq = data[‘cfg’].value_counts()*4`

because cfg_freq (that you are using for size) length differs from the other series (WT_Number, CFG_Number) you are using to create the xs and ys (unless you only have unique values…) . value_counts() returns the counts for unique values on data[‘cfg’]… What strikes me is that you should have at least a warning at the consule telling about the length difference…

As a first step to try to make it happen I’d suggest you to have something like:

cfg_freq = data[‘cfg’]

and check if that works… If it works then you can create a function that actually takes data[‘cfg’] and returns a list of N values to express your size logic, so you can use it on the wt_cfg_plot.scatter call

Hope that helps

Fabio

On Thu, May 5, 2016 at 9:49 AM, Daniel Morgan [email protected] wrote:

This relates to this Stack Overflow question.

I’m new to python, plotting, and bokeh, so I’m hoping I’m doing something wrong that is quite simple.

Something breaks when I try to change the size of plot markers on a scatter plot to reflect the value count of a column of data.

Here’s a link to the .py file. I removed any sensitive data (credentials), but kept everything else as is.

I was getting a successful plot (1st image, further down), but when I added the below to try and change the marker sizes it gets screwy (2nd image):

Variable for the frequency count of Control Form Groups (for scatter plot)

cfg_freq = data[‘cfg’].value_counts()*4

``

Changed the size:

Set up the plot points, including the Hover Tool

cr = wt_cfg_plot.scatter(WT_Number, CFG_Number, size=cfg_freq, fill_color=“blue”,
line_color=None, alpha=0.7, hover_fill_color=“firebrick”,
hover_line_color=None, hover_alpha=1)

``

The 1st Image. All is good so far. For this size=7

The 2nd image, with the new size applied. Shenanigans. At the bottom is the full error message. The linked .py file has the code as it was.

The full error message:

Traceback (most recent call last):

File “”, line 1, in
runfile(‘/python_file’, wdir=‘/working_directory’)

File “/Applications/anaconda/lib/python3.5/site-packages/spyderlib/widgets/externalshell/sitecustomize.py”, line 699, in runfile
execfile(filename, namespace)

File “/Applications/anaconda/lib/python3.5/site-packages/spyderlib/widgets/externalshell/sitecustomize.py”, line 88, in execfile
exec(compile(open(filename, ‘rb’).read(), filename, ‘exec’), namespace)

File “/python_file”, line 142, in
ylabel=‘Control Form Group’)

File “/Applications/anaconda/lib/python3.5/site-packages/bokeh/charts/builders/scatter_builder.py”, line 63, in Scatter
return create_and_build(ScatterBuilder, data, **kws)

File “/Applications/anaconda/lib/python3.5/site-packages/bokeh/charts/builder.py”, line 66, in create_and_build
chart = Chart(**chart_kws)

File “/Applications/anaconda/lib/python3.5/site-packages/bokeh/charts/chart.py”, line 125, in init
super(Chart, self).init(*args, **kwargs)

File “/Applications/anaconda/lib/python3.5/site-packages/bokeh/models/plots.py”, line 78, in init
super(Plot, self).init(**kwargs)

File “/Applications/anaconda/lib/python3.5/site-packages/bokeh/model.py”, line 77, in init
super(Model, self).init(**kwargs)

File “/Applications/anaconda/lib/python3.5/site-packages/bokeh/core/properties.py”, line 701, in init
setattr(self, name, value)

File “/Applications/anaconda/lib/python3.5/site-packages/bokeh/core/properties.py”, line 722, in setattr
(name, self.class.name, text, nice_join(matches)))

AttributeError: unexpected attribute ‘size’ to Chart, possible attributes are above, background_fill_alpha, background_fill_color, below, border_fill_alpha, border_fill_color, disabled, extra_x_ranges, extra_y_ranges, h_symmetry, height, hidpi, left, legend, lod_factor, lod_interval, lod_threshold, lod_timeout, logo, min_border, min_border_bottom, min_border_left, min_border_right, min_border_top, name, outline_line_alpha, outline_line_cap, outline_line_color, outline_line_dash, outline_line_dash_offset, outline_line_join, outline_line_width, plot_height, plot_width, renderers, responsive, right, tags, title, title_standoff, title_text_align, title_text_alpha, title_text_baseline, title_text_color, title_text_font, title_text_font_size, title_text_font_style, tool_events, toolbar_location, tools, v_symmetry, webgl, width, x_mapper_type, x_range, xgrid, xlabel, xscale, y_mapper_type, y_range, ygrid, ylabel or yscale

``

I’ll finish this by saying that I have no idea how to successfully change the marker sizes by value in any other package. This is all pretty much the first time I’m doing any of it, I’m learning as I go!

You received this message because you are subscribed to the Google Groups “Bokeh Discussion - Public” group.

To unsubscribe from this group and stop receiving emails from it, send an email to [email protected].

To post to this group, send email to [email protected].

To view this discussion on the web visit https://groups.google.com/a/continuum.io/d/msgid/bokeh/759f01ad-dc38-47d0-b6cf-9b78a1adb111%40continuum.io.

For more options, visit https://groups.google.com/a/continuum.io/d/optout.


Fabio Pliger

Senior Software Engineer, Bokeh

Wow, changing it to:

cfg_freq = data[‘cfg’]

Worked.

You, Sir, are some sort of mystical wizard. Thanks so much!

:slight_smile:

Glad it worked!

···

On Sunday, May 8, 2016 at 4:01:39 PM UTC-5, Daniel Morgan wrote:

On Thursday, May 5, 2016 at 8:44:17 PM UTC+2, Fabio Pliger wrote:

Hi,

The error you are getting doesn’t seem related related to the parts posted here at all. My best blind guess is that it’s bein raised due to an unused code in tail of your script where you create a High Level Scatter Chart.

As for the weirdness related to the size of the scatter points, I think it’s related to this call:

`

Variable for the frequency count of Control Form Groups (for scatter plot)

cfg_freq = data[‘cfg’].value_counts()*4`

because cfg_freq (that you are using for size) length differs from the other series (WT_Number, CFG_Number) you are using to create the xs and ys (unless you only have unique values…) . value_counts() returns the counts for unique values on data[‘cfg’]… What strikes me is that you should have at least a warning at the consule telling about the length difference…

As a first step to try to make it happen I’d suggest you to have something like:

cfg_freq = data[‘cfg’]

and check if that works… If it works then you can create a function that actually takes data[‘cfg’] and returns a list of N values to express your size logic, so you can use it on the wt_cfg_plot.scatter call

Hope that helps

Fabio

On Thu, May 5, 2016 at 9:49 AM, Daniel Morgan [email protected] wrote:

This relates to this Stack Overflow question.

I’m new to python, plotting, and bokeh, so I’m hoping I’m doing something wrong that is quite simple.

Something breaks when I try to change the size of plot markers on a scatter plot to reflect the value count of a column of data.

Here’s a link to the .py file. I removed any sensitive data (credentials), but kept everything else as is.

I was getting a successful plot (1st image, further down), but when I added the below to try and change the marker sizes it gets screwy (2nd image):

Variable for the frequency count of Control Form Groups (for scatter plot)

cfg_freq = data[‘cfg’].value_counts()*4

``

Changed the size:

Set up the plot points, including the Hover Tool

cr = wt_cfg_plot.scatter(WT_Number, CFG_Number, size=cfg_freq, fill_color=“blue”,
line_color=None, alpha=0.7, hover_fill_color=“firebrick”,
hover_line_color=None, hover_alpha=1)

``

The 1st Image. All is good so far. For this size=7

The 2nd image, with the new size applied. Shenanigans. At the bottom is the full error message. The linked .py file has the code as it was.

The full error message:

Traceback (most recent call last):

File “”, line 1, in
runfile(‘/python_file’, wdir=‘/working_directory’)

File “/Applications/anaconda/lib/python3.5/site-packages/spyderlib/widgets/externalshell/sitecustomize.py”, line 699, in runfile
execfile(filename, namespace)

File “/Applications/anaconda/lib/python3.5/site-packages/spyderlib/widgets/externalshell/sitecustomize.py”, line 88, in execfile
exec(compile(open(filename, ‘rb’).read(), filename, ‘exec’), namespace)

File “/python_file”, line 142, in
ylabel=‘Control Form Group’)

File “/Applications/anaconda/lib/python3.5/site-packages/bokeh/charts/builders/scatter_builder.py”, line 63, in Scatter
return create_and_build(ScatterBuilder, data, **kws)

File “/Applications/anaconda/lib/python3.5/site-packages/bokeh/charts/builder.py”, line 66, in create_and_build
chart = Chart(**chart_kws)

File “/Applications/anaconda/lib/python3.5/site-packages/bokeh/charts/chart.py”, line 125, in init
super(Chart, self).init(*args, **kwargs)

File “/Applications/anaconda/lib/python3.5/site-packages/bokeh/models/plots.py”, line 78, in init
super(Plot, self).init(**kwargs)

File “/Applications/anaconda/lib/python3.5/site-packages/bokeh/model.py”, line 77, in init
super(Model, self).init(**kwargs)

File “/Applications/anaconda/lib/python3.5/site-packages/bokeh/core/properties.py”, line 701, in init
setattr(self, name, value)

File “/Applications/anaconda/lib/python3.5/site-packages/bokeh/core/properties.py”, line 722, in setattr
(name, self.class.name, text, nice_join(matches)))

AttributeError: unexpected attribute ‘size’ to Chart, possible attributes are above, background_fill_alpha, background_fill_color, below, border_fill_alpha, border_fill_color, disabled, extra_x_ranges, extra_y_ranges, h_symmetry, height, hidpi, left, legend, lod_factor, lod_interval, lod_threshold, lod_timeout, logo, min_border, min_border_bottom, min_border_left, min_border_right, min_border_top, name, outline_line_alpha, outline_line_cap, outline_line_color, outline_line_dash, outline_line_dash_offset, outline_line_join, outline_line_width, plot_height, plot_width, renderers, responsive, right, tags, title, title_standoff, title_text_align, title_text_alpha, title_text_baseline, title_text_color, title_text_font, title_text_font_size, title_text_font_style, tool_events, toolbar_location, tools, v_symmetry, webgl, width, x_mapper_type, x_range, xgrid, xlabel, xscale, y_mapper_type, y_range, ygrid, ylabel or yscale

``

I’ll finish this by saying that I have no idea how to successfully change the marker sizes by value in any other package. This is all pretty much the first time I’m doing any of it, I’m learning as I go!

You received this message because you are subscribed to the Google Groups “Bokeh Discussion - Public” group.

To unsubscribe from this group and stop receiving emails from it, send an email to [email protected].

To post to this group, send email to [email protected].

To view this discussion on the web visit https://groups.google.com/a/continuum.io/d/msgid/bokeh/759f01ad-dc38-47d0-b6cf-9b78a1adb111%40continuum.io.

For more options, visit https://groups.google.com/a/continuum.io/d/optout.


Fabio Pliger

Senior Software Engineer, Bokeh