Getting axes to line up in multiple plots in column, with embedded tabs

Hello!

I am brand new to Bokeh (and programming in general), and I have a question about getting the vertical axis of figures to align within a column. I am trying to have a column with two sections:
1: a figure that fills the whole width of the column
2: a Tabs object with three tabs, directly below figure 1, that also fills the whole width of the column

I’m able to get everything set up, and I’m even able to get all of the figures to share an x-axis, which is exactly what I want. However, while the axes in the tab object are aligned with one another, they are out of line with the axis in figure 1.

I believe this may be related to the following issues on GitHub, but I’m not sure.

Does anyone have suggestions for getting the axes to line up in this way? The issue seems to only occur when I place the figures in panels/tabs, and when I vertically stack them in the column outside of a tab object, everything lines up as expected.

Please let me know if I can provide more information; a code sample will be forthcoming.

Thanks!
Hi @tal-z it’s hard to visualize what exactly you are seeing (and what you want to see). Please provide a Minimal Reproducible Example so that others can easily investigate exactly what you dealing with. Some screenshots would probably also be helpful for an issue like this.

Hi Bryan, thanks for the speedy response!

First of all, let me say that Bokeh is awesome. Thank you for your work!

Second, here is my attempt at a minimal reproducible example. Please let me know if there are ways that I could improve this example or otherwise provide greater clarity:

from bokeh.plotting import figure, output_file, show
from bokeh.layouts import column
from bokeh.models import  ColumnDataSource, Tabs, Panel

data = dict(x_values=[1,2,3,4,5],
            y1_values=[100000,300000,200000,500000,400000],
            y2_values=[10,20,40,90,50],
            y3_values=[1,8,5,6,8],
            y4_values=[70,10,30,60,20]
            )

source = ColumnDataSource(data=data)

p1 = figure(title="p1", height=350, width=1400)
p1.line(x='x_values', y='y1_values', source=source)

p2 = figure(title="p2", x_range=p1.x_range, height=350, width=1400)
p2.line(x='x_values', y='y2_values', source=source)

tab_a = Panel(child=p2, title=p2.title.text)

p3 = figure(title="p3", x_range=p1.x_range, height=350, width=1400)
p3.line(x='x_values', y='y3_values', source=source)

tab_b = Panel(child=p3, title=p3.title.text)

p4 = figure(title="p1", x_range=p1.x_range, height=350, width=1400)
p4.line(x='x_values', y='y4_values', source=source)

tab_c = Panel(child=p4, title=p4.title.text)

tabs = Tabs(tabs=[tab_a, tab_b, tab_c])

output_file("test.html")
show(column(p1,tabs))

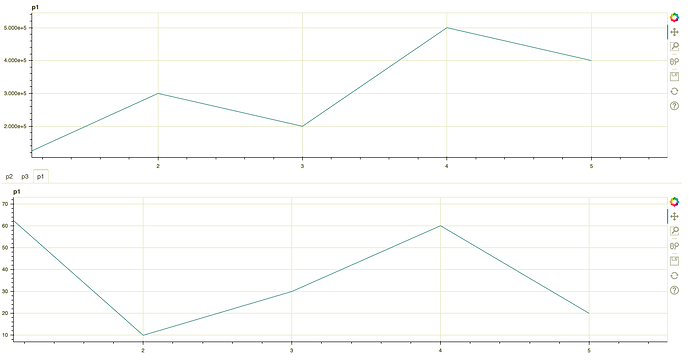
This gives me the following visual:

When I drag either the top or bottom figure, the top and bottom do remain aligned along the x-axis. However, there is an offset in their alignment seemingly due to the size of the label text along the vertical axes. This is not an issue within the Tabs object, but is an issue between the top and bottom figures.

Any ideas on how I could address this? Thanks so much for your help!

edit: Upon further inspection, because their widths are the same, scaling may be different between the top and bottom as well. Is that possible?

FYI @tal-z you have pasted the code as a plain-text quote which does not preserve any of the proper code formatting. In the future, please use the </> icon on the editing toolbar, or triple backtick ``` fences around the code blocks so that code formatting works.

Bokeh will always shift the axis position inside the canvas to accommodate the entire width of the axis labels. For the above case, there are a few possible things you could do:

  • orient the labels vertically instead of horizontally, so that they always take up the same amount of space (in the horizontal direction left of the plot)
  • use a different label format that takes up less space in the top plot (or more space in the bottom plot)
  • set a common value on both plots for min_border_left so that both plots always set aside a minimum amount of space to the left (you would want to set the value as large as the largest label size you expect)

Or some combination of all three.

@Bryan, thanks for these tips! I’m sure some combo of these will produce the results I’m looking for. I’ve updated my code block as well, thanks for the suggestion.

Cheers!

1 Like