I’m trying to get the ColumnDataSource of a selected item (e.g. via Tap tool) into a Python variable. I’m sure this is simple but I don’t understand the CustomJS mechanism well enough to work out how to do it. It doesn’t help that my JS knowledge is virtually nonexistent!
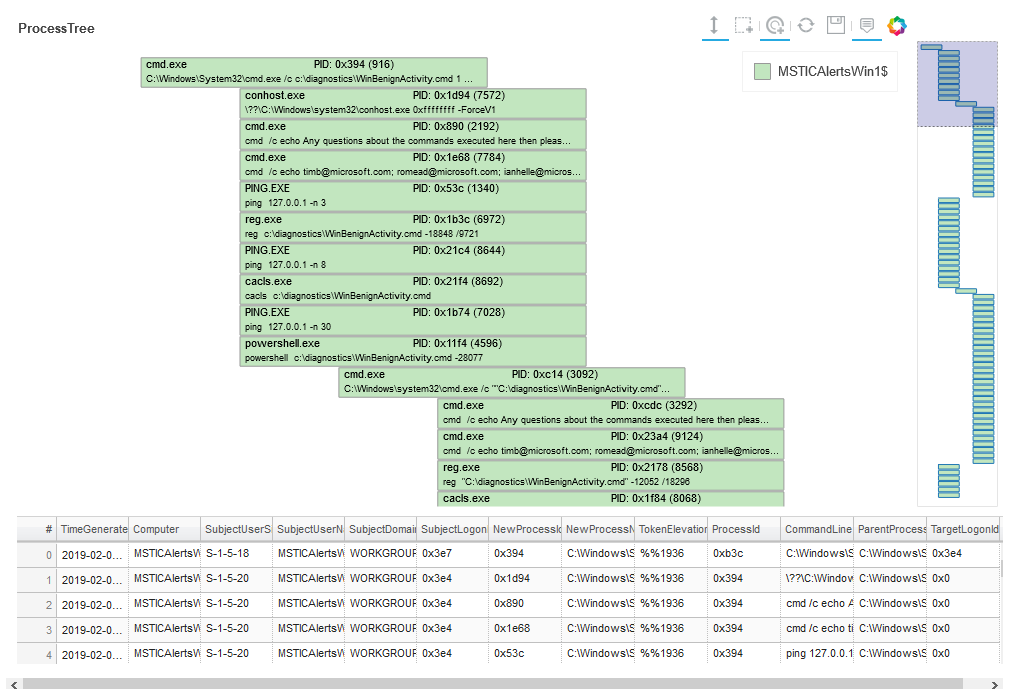
I have a chart - it’s actually a process tree - I want people to be able to select one or more items and be able to retrieve the corresponding items from the ColumnDataSource (just getting the indices of the rect glyphs would be enough). All I want to do have the values persisted to some kind of array. I can then use this to pull more detailed information about the selected process(es). This would be some other python code that does queries from other sources - probably triggered by some other widget rather than from a bokeh event.
    from bokeh.io import output_notebook, show, output_file, reset_output
    from bokeh.plotting import figure
    from bokeh.transform import dodge, factor_cmap
    from bokeh.models import HoverTool, ColumnDataSource, CustomJS
    from bokeh.models.callbacks import CustomJS

    reset_output()
    output_notebook()
    n_levels = p_tree_srt["PlotLevel"].unique()

    source = ColumnDataSource(data=p_tree_srt)
    TOOLTIPS = [
        ("Name", "@NewProcessName"),
        ("Cmd", "@CommandLine"),
        ("User", "@SubjectUserName"),
        ("Time", "@TimeGenerated{%F %T}")
    ]
    plot_height = 35 * len(p_tree_srt)
    p = figure(title="ProcessTree", plot_width=900, plot_height=3500,
               x_range=(-1, max(n_levels) + 1),
               tools=["hover", "xwheel_zoom", "box_zoom", "reset", "save", "xpan", "tap"])
    hover = HoverTool(tooltips=TOOLTIPS, formatters={'TimeGenerated': 'datetime'})
    p.add_tools(hover)

    r = p.rect("PlotLevel", "Row", 3.5, 0.95, source=source, fill_alpha=0.6)
    text_props = {"source": source, "text_align": "left", "text_baseline": "middle"}
    x = dodge("PlotLevel", -1.7, range=p.x_range)
    p.text(x=x, y="Row", text="CommandLine", text_font_size="8pt", **text_props)
    p.text(x=x, y=dodge("Row", 0.3, range=p.y_range), text="NewProcessId",
           text_font_size="6pt", **text_props)
    p.text(x=dodge("PlotLevel", -1.4, range=p.x_range), y=dodge("Row", 0.3, range=p.y_range), text="Exe",
           text_font_size="6pt", **text_props)

    p.outline_line_color = None
    p.grid.grid_line_color = None
    p.axis.axis_line_color = None
    p.axis.major_tick_line_color = None
    p.axis.major_label_standoff = 0
    p.hover.renderers = [r] # only hover element boxes

    target = ColumnDataSource()
    callback = CustomJS(args=dict(source=source, target=target), code="""
            // get data source from Callback args
            var inds = source.selected.indices;

            target.data = inds;
            cb_data.source.change.emit();  // I've tried multiple things here
        """)
    p.js_on_event('tap', callback)
    show(p)