Following the suggestion here:
Get Current Plot Ranges · Issue #6782 · bokeh/bokeh · GitHub
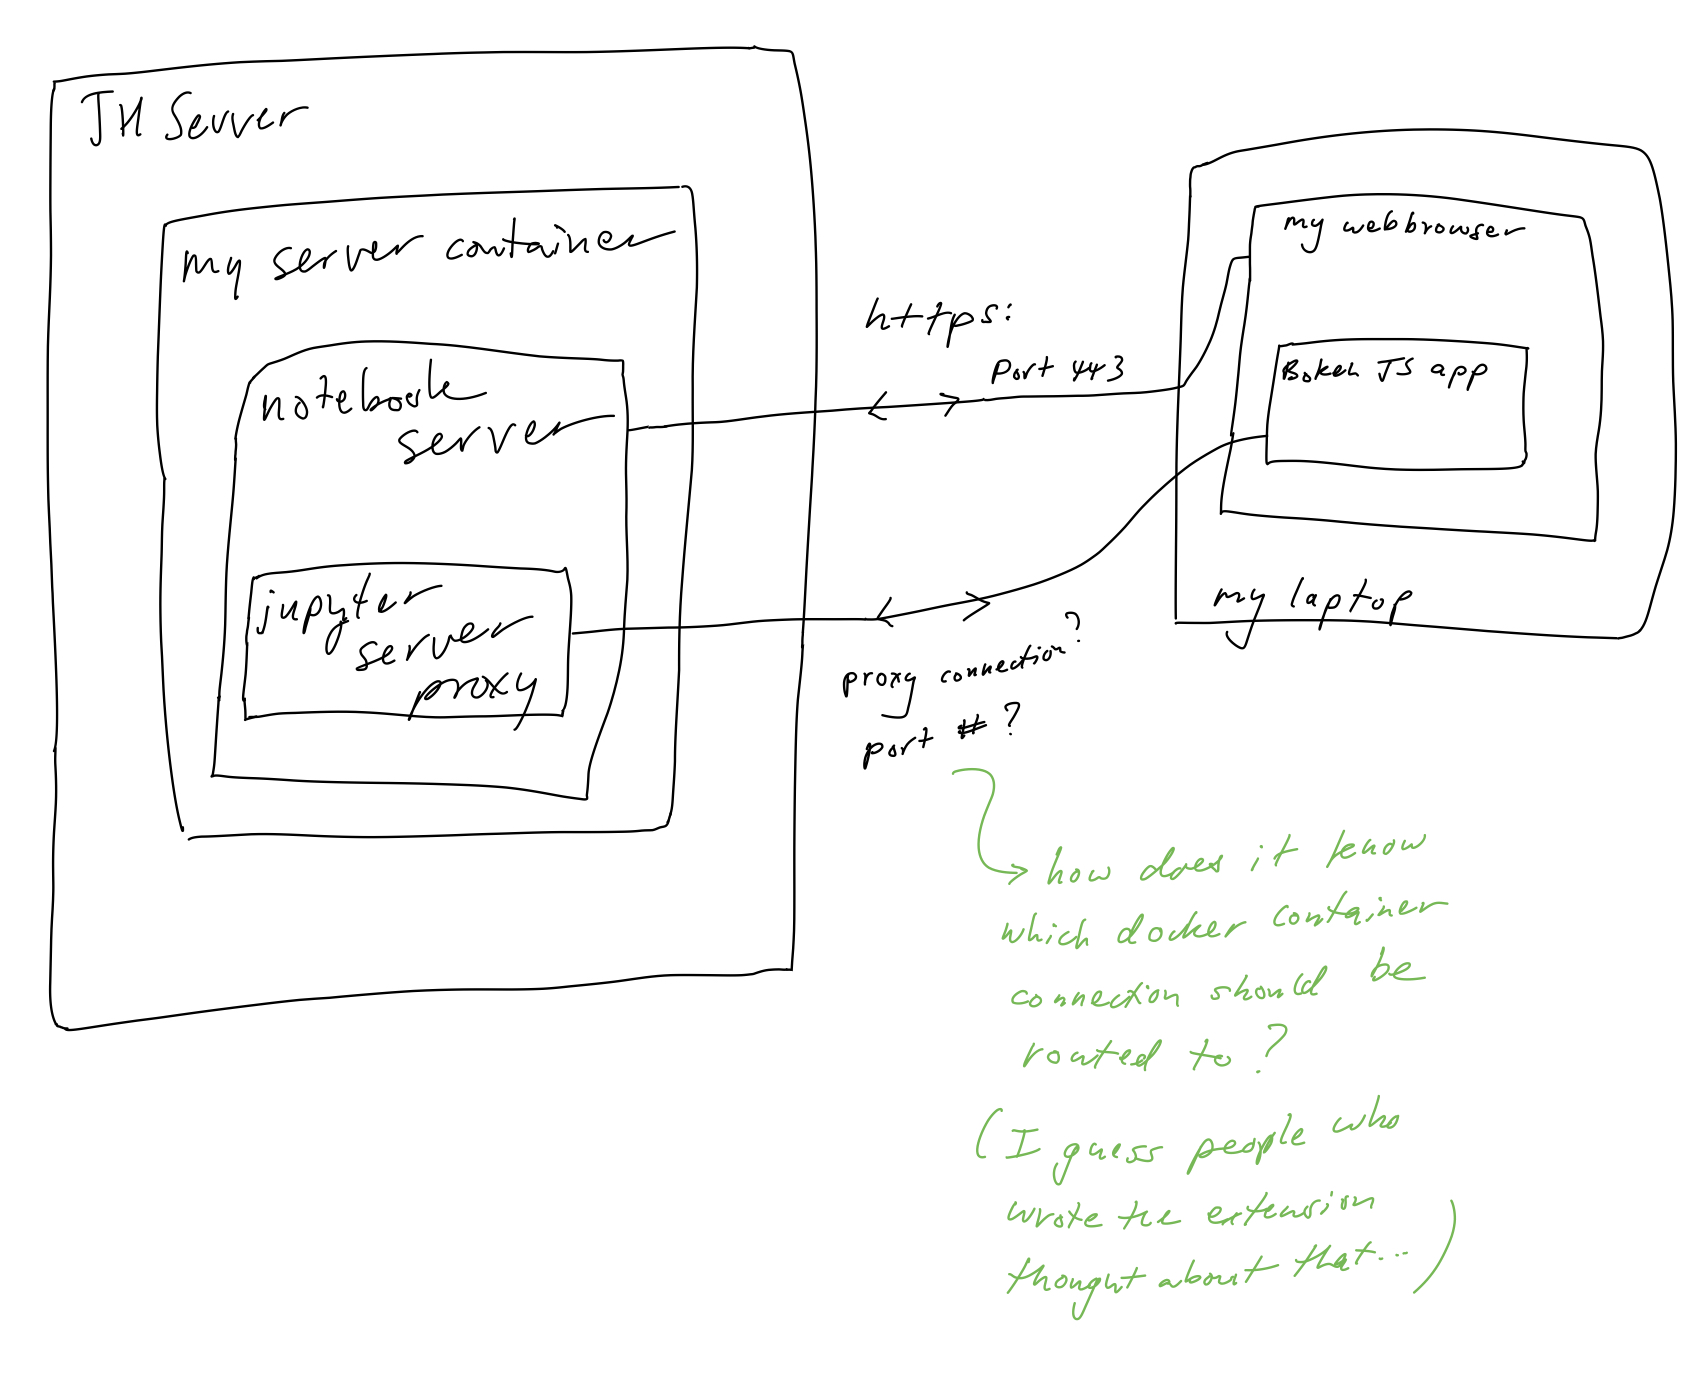
I’m posting my question here ![]()
The question was:
Ok, I’m a bit of a noob. I’m trying to get the current zoom range after an interactive zoom in a notebook.
I start with this:
import numpy as np

from bokeh.plotting import figure, show
from bokeh.io import output_notebook, push_notebook
from bokeh.models import ColumnDataSource, Range1d
from bokeh.layouts import column, row

import ipywidgets as widgets

output_notebook()
Then I create a plot:
# Magnitude plot
source1 = ColumnDataSource()
x = np.linspace(0,1,100)
y = x**2
xr  = Range1d()
source1.data = dict(x=x, y=y)
p1 = figure(plot_width=600,plot_height=400, x_range = xr)
p1.line('x', 'y', source=source1)
p1.xaxis.axis_label =  "Test"
target = show(p1, notebook_handle=True)
Then I zoom around a bit, and in the next cell I check what the value of the x-range is:
p1.x_range.start
Regardless of what I zoom to, the value of p1.x_range.start is always 0. Am I missing something here?
From the reply of Bryan van der Ven, it seems like I need to do something different than show:
showwith notebook handles is for one-way Python->JS updates only. If you want to have bi-directional updates back to Python, you would need to embed a Bokeh server app in the notebook. Happy to discuss but the appropriate venue is the project Discourse:
Any suggestions?
Thanks!
Gary