Glyphs (circles/ellipses) with more than one color?

Hi!
I’m new to Bokeh, but am really enjoying what we can do with this toolset.
Currently I’m trying to show ellipses that convey statistical meaning in their plot space, but that come from a combination of different source types, which are important to rapid understanding of the visualization to an analyst.
I attempted key different colors to each ellipse by duplicating the data entries in the CDS and using different line_dash, line_widths and colors to mark with the two or three most important sources present by unique key colors.
This worked OK, but my hoverTools (also a key feature for textual data associated with the spatial layouts I’m portraying now stack the duplicated data from the duplicated entries in the HoverTip.
Is there a more elegant way to multiColor key glyphs like ellipse or control display of tooltip data on a per glyph basis from the CDS? I attempted this by passing a list of booleans into the CDS and controlling visualization that way, but then found that .visible can’t be controlled in that manner.

Thanks for taking a read on this!!

S
Hi @spoolio welcome to the discourse. There’s a variety of different possibilities for having glyph instances render with different properties (color, etc). I don’t quite understand what you tried (or what’s going on with the hover tool) just from the description above. A complete Minimal Reproducible Example (and possibly a screenshot if possible) that illustrates your approach would go a long way towards helping us provide concrete guidance.

Bryan,
Thanks for the response! I’ll reproduce what I can here.

I call hPlot(), shown in brief below, and pass it a pre-formatted figure and a CDS with the relevant fields and data processed by our backend code.

def hPlot(fig, sourceData):
    

    tooltips = [('Entity', '@Entity{0}'),
                ('Number', '@Number{0}'),
                ('Dist', '@dst{0.0}'),
                ('Azimuth', '@az{0.0}'),
                ('Elevation', '@el{0.0}'),
                ('Source', '@source'),
              # Plus a bunch of associated textual information useful to an analyst ]
    gEllipse = fig.ellipse(x='x', y='y', source=sourceData,
                           height='h_err', width='x_err', angle='angle',
                           line_color='color', fill_color=None,
                           line_width='lineWeight', line_dash='lineStyle', 
                           name='ellipse')
    gEllipse.nonselection_glyph = bm.glyphs.Ellipse(line_color='red',
                                                    fill_color=None,
                                                    line_alpha=0.3)
 
    gCircle = fig.circle(x='x', y='y', source=sourceData,
                         line_color=None, fill_color='white',
                         size=2, name='estimate')
    gCircle.nonselection_glyph = bm.glyphs.Circle(line_color=None,
                                                  fill_color='red',
                                                  fill_alpha=0.3)
    fig.add_tools(bm.HoverTool(tooltips=tooltips, names=['estimate', 'ellipse']))

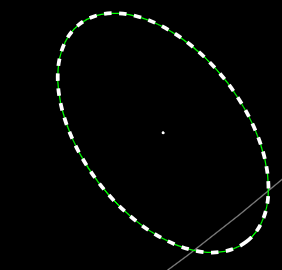
I’m trying to get the gCircle items on the parameter estimate with the ellipse about the measurement uncertainties, but with several potentially contributing data sources, I want to show something roughly like the below:
image
I’m currently doing this by plotting a wider dashed colored ellipse over a solid contrasting ellipse (each is a line in the CDS). In a perfect world I’d like to be able to make the outline element for the glyph (ellipses in this case) with a list of colors to convey the contributing sources around the edge (white, red, green, blue, etc.).
The problem with my approach is that this doubles up the centerpoints, and the hovertool tips stack the data for both circle entries on top of each other.

To fix this, I attempted to pass a ‘visible’ attribute boolean column in the sourceData CDS from the backend to control which circles would be shown, but the visible attribute isn’t able to be used that way apparently.

Hope that helps flesh it out a bit more–thanks for the feedback, Bryan!

S

Oh just to be clear, you want each individual ellipse to have more than one color? Bokeh does not support that (because the underlying HTML Canvas does not have any APIs like that). I think you approach of “plotting a wider dashed colored ellipse over a solid contrasting ellipse” is about the best approach you can expect.

The problem with my approach is that this doubles up the centerpoints, and the hovertool tips stack the data for both circle entries on top of each other.

Do you need to have the hover tool report on both? You can restrict the HoverTool to just a a subset of glyphs using its renderer property.

This topic was automatically closed 90 days after the last reply. New replies are no longer allowed.