Hi,
I’m trying to plot glyph circles on a map, based on a timeline. This was working fine with Bokeh 1.4.0, but doesn’t work anymore after upgrading to Bokeh 2.4.3.
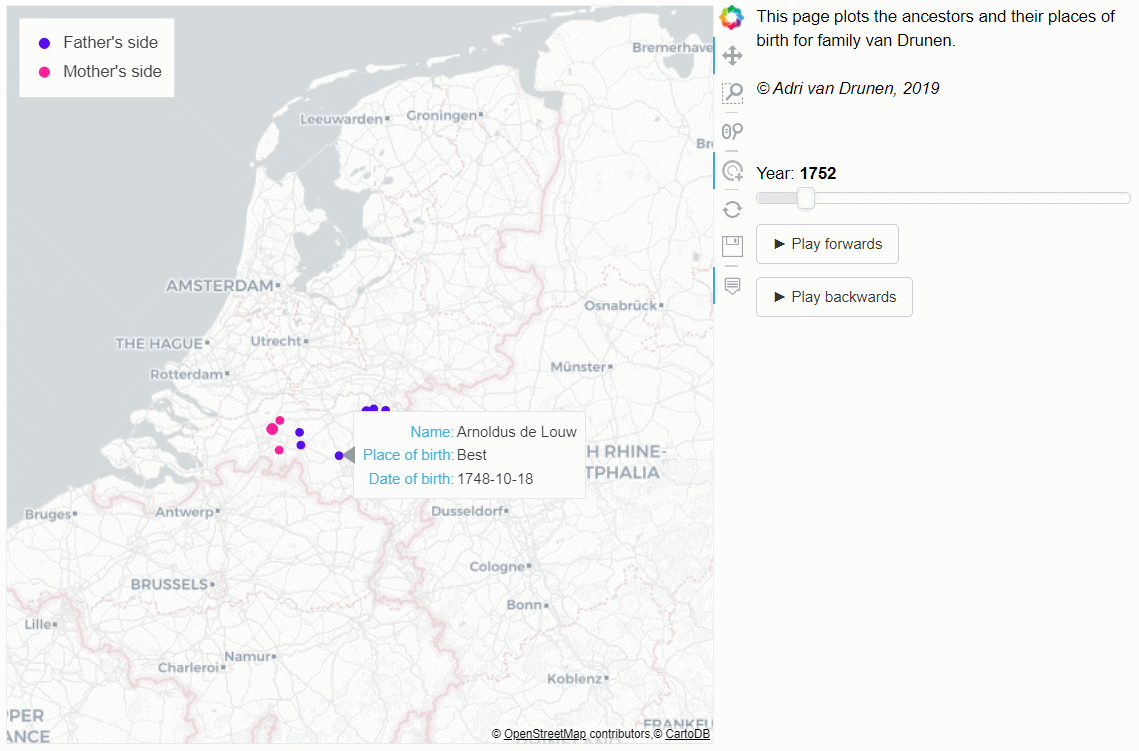
The map, filters, buttons and slider are shown. The only thing missing is the circle glyphs…
The desired end result:
The code used:
import pandas as pd
import numpy as np
from datetime import datetime, date
from bokeh.io import output_file, curdoc
from bokeh.layouts import row, column
from bokeh.plotting import figure, show, reset_output
from bokeh.models import HoverTool, ColumnDataSource, CDSView, GroupFilter
from bokeh.models.widgets import Slider, Button, Div
from bokeh.tile_providers import get_provider, Vendors

# First read the data, as generated via Python script 'generate_ancestor_file.py'
df_ancestors = pd.read_csv('exported_ancestor_list_short.csv', sep=',', dtype={'Persoon' : int, 'Achternaam' : str, 'Voornaam': str, 'Voorvoegsel' : str, 'date_of_birth' : object, 'place_of_birth' : str, 'date_of_death' : object, 'mothers_side' : object, 'mercator_x_birth' : object, 'mercator_y_birth' : object, 'mercator_x_death' : object, 'mercator_y_death' : object, 'year_of_birth' : int, 'year_of_death' : int, 'year_of_reference' : int, 'if_alive_nr_of_alive_persons_same_birthplace' : int, 'glyph_size' : int})

# Set date fields as date type fields
df_ancestors['date_of_birth'] = pd.to_datetime(df_ancestors['date_of_birth'], format="%Y-%m-%d")
df_ancestors['date_of_death'] = pd.to_datetime(df_ancestors['date_of_death'], format="%Y-%m-%d")

# Clean up dataframe, replacing all NaN values with an empty string
df_ancestors = df_ancestors.replace(np.nan, '', regex=True)

# Create ColumnDataSource object for use in Slider, combining father and mother ancestors
source = ColumnDataSource(df_ancestors)
view_mother = CDSView(source=source, filters=[GroupFilter(column_name='mothers_side', group="Y")])
view_father = CDSView(source=source, filters=[GroupFilter(column_name='mothers_side', group="N")])
view_mother_and_father = CDSView(source=source, filters=[GroupFilter(column_name='mothers_side', group="X")])

# Determine where the visualization will be rendered
output_file('ancestormap.html')

# Instantiate and set up the figure() object
# Set x and y axis ranges to set world view
netherlands = x_range,y_range = ((307981,931980),(6448127,7123456))

map_plot = figure(tools='pan, wheel_zoom, box_zoom, reset, tap, save', toolbar_location="right",
        x_range=x_range, y_range=y_range, x_axis_type="mercator", y_axis_type="mercator")
tile_provider = get_provider(Vendors.CARTODBPOSITRON)
map_plot.add_tile(tile_provider)
map_plot.axis.visible = False

# Add the 'glyphs' - the ancestors - location based on place of birth
map_plot.circle('mercator_x_birth', 'mercator_y_birth', size='glyph_size', color='#4422EE', hover_fill_color="red",
    legend_label="Father's side", muted_alpha=0.2, source=source, view=view_father, visible=True, level='overlay')
map_plot.circle('mercator_x_birth', 'mercator_y_birth', size='glyph_size', color='#FE249A', hover_fill_color="red",
    legend_label="Mother's side", muted_alpha=0.2, source=source, view=view_mother)
map_plot.circle('mercator_x_birth', 'mercator_y_birth', size='glyph_size', color='#00BB27', hover_fill_color="red",
    muted_alpha=0.2, source=source, view=view_mother_and_father)

# Add time slider:
current_year = date.today().year
start_year = df_ancestors['date_of_birth'].min(skipna=True)
start_year = datetime.strftime(start_year, '%Y%m%d')
start_year = int(start_year[0:4])
initial_year = 1940
time_slider = Slider(start=start_year, end=initial_year, value=initial_year, step=1, title="Year")

# Initialize map, showing the glyphs in line with initial Slider setting (same code as in function callback)
df_ancestors_specific_year = df_ancestors[(df_ancestors['if_alive_nr_of_alive_persons_same_birthplace']>0) & (df_ancestors['year_of_reference']==initial_year)]
source = ColumnDataSource(data=df_ancestors_specific_year)

# Define callback function, that will be called on changing the time slider
def callback(attr, old, new):
    # Select those records of ancestors that were born before or in the selected year AND
    # are alive or died after or in the selected year.
    df_ancestors_specific_year = df_ancestors[(df_ancestors['if_alive_nr_of_alive_persons_same_birthplace']>0) & (df_ancestors['year_of_reference']==new)]
    source = ColumnDataSource(data=df_ancestors_specific_year)

# Call function Callback on changing the slider
time_slider.on_change('value', callback)

# Add play button
callback_id = None

def animate_update():
    year = time_slider.value + 1
    if year > initial_year:
        year = start_year
    time_slider.value = year


def animate_update_back():
    year = time_slider.value - 1
    if year < start_year:
        year = initial_year
    time_slider.value = year


def animate():
    global callback_id
    if button.label == '► Play forwards' and button2.label == '► Play backwards':
        button.label = '❚❚ Pause forwards'
        callback_id = curdoc().add_periodic_callback(animate_update, 200)
    else:
        button.label = '► Play forwards'
        curdoc().remove_periodic_callback(callback_id)
        # The following additional line of code is required to make the pause button work in Safari
        curdoc().remove_on_change()

def animateback():
    global callback_id
    if button2.label == '► Play backwards' and button.label == '► Play forwards':
        button2.label = '❚❚ Pause backwards'
        callback_id = curdoc().add_periodic_callback(animate_update_back, 200)
    else:
        button2.label = '► Play backwards'
        curdoc().remove_periodic_callback(callback_id)
        # The following additional line of code is required to make the pause button work in Safari
        curdoc().remove_on_change()


button = Button(label='► Play forwards', width=60)
button.on_click(animate)

button2 = Button(label='► Play backwards', width=60)
button2.on_click(animateback)

div = Div(text="""This page plots the ancestors and their places of birth.<br><br><br>""")

# Put the legend in the upper left corner
map_plot.legend.location = 'top_left'

# Add interactivity to the legend (an alternative to 'hide' is 'mute').
map_plot.legend.click_policy = 'hide'

# Format the tooltip
tooltips = [
            ('Name','@Voornaam @Voorvoegsel @Achternaam'),
            ('Place of birth','@place_of_birth'),
            ('Date of birth','@date_of_birth{%F}'),
           ]

# Add the HoverTool to the figure
map_plot.add_tools(HoverTool(tooltips=tooltips, formatters={
        'date_of_birth': 'datetime', # use 'datetime' formatter for 'Date of birth' field
    })
)

# Organize the layout
layout = row(
    map_plot,
    column(div, time_slider, button, button2),
)

# Use reset_output() between subsequent show() calls, as needed
reset_output()

# Preview
show(map_plot)

curdoc().title = "Birth places of my Ancestors"
curdoc().add_root(layout)
Any help is appreciated.