Hi,
I have a bokeh application which I want to run through my own server IBM WebSphere HTTP & Application Server 8.5.1. Can anyone please provide me some material / resources / links where I can find how to run my python script bokeh app through IBM WebSphere HTTP & Application Server 8.5.1. so that my dynamic bokeh application can run on IBM WebSphere HTTP & Application Server 8.5.1, I don’t want to run through the bokeh server as i want to give my dynamic bokeh application access to large number of group/public.
I will really appreciate if someone provides some helpful links/resources.
Thank you.
There are some examples with Nginx and Apache here: Running a Bokeh server — Bokeh 2.4.2 Documentation
But maybe your web server can run Python - in that case Running a Bokeh server — Bokeh 2.4.2 Documentation could be more pertinent.
Hi,
Thanks for quick reply.
i have seen the above links provided.
i have interactive dynamic bokeh plot, my plot contain dropdown option , openstreetmap ,so as per my dropdown option my plot change.
I need to have plot url as like my systemipaddress and particular portnumber .
Nothing you specify precludes you from using the solutions provided by the articles linked above. It all depends on how you configure your web server. Bokeh doesn’t limit you here in any way.
1 Like
I have made simple program related to my plot sample plot where i can generating data in script itself and plotted .
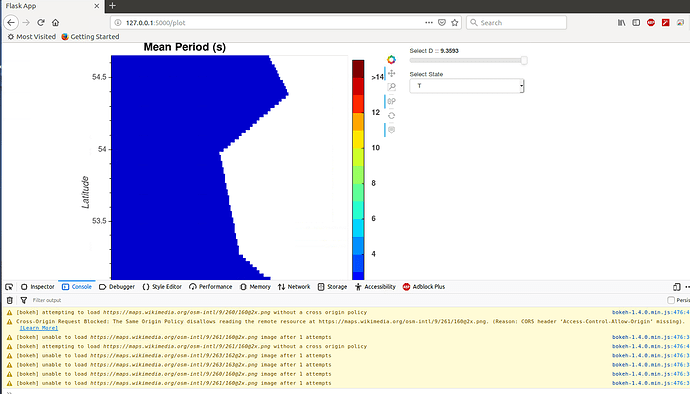
As previous plot is acting dynamic in jupyter but while bokeh plot embedding into flask dynamic nature of plot vanish . 
You can try code is below - simple sample code.
Main python scriptfile
from flask import Flask, render_template
from werkzeug.wrappers import Request, Response
from bokeh.embed import file_html
from flask import Flask,Markup
app = Flask( **name** )
@app.route('/plot')
def plot():
import numpy as np
import pandas as pd
import geoviews as gv
import holoviews as hv
import panel as pn
from holoviews.operation.datashader import rasterize
hv.extension("bokeh")
from bokeh.models.callbacks import CustomJS
# Some points defining a triangulation over (roughly) Britain.
xy = np.asarray([
[-0.101, 0.872], [-0.080, 0.883], [-0.069, 0.888], [-0.054, 0.890],
[-0.045, 0.897], [-0.057, 0.895], [-0.073, 0.900], [-0.087, 0.898],
[-0.090, 0.904], [-0.069, 0.907], [-0.069, 0.921], [-0.080, 0.919],
[-0.073, 0.928], [-0.052, 0.930], [-0.048, 0.942], [-0.062, 0.949],
[-0.054, 0.958], [-0.069, 0.954], [-0.087, 0.952], [-0.087, 0.959],
[-0.080, 0.966], [-0.085, 0.973], [-0.087, 0.965], [-0.097, 0.965],
[-0.097, 0.975], [-0.092, 0.984], [-0.101, 0.980], [-0.108, 0.980],
[-0.104, 0.987], [-0.102, 0.993], [-0.115, 1.001], [-0.099, 0.996],
[-0.101, 1.007], [-0.090, 1.010], [-0.087, 1.021], [-0.069, 1.021],
[-0.052, 1.022], [-0.052, 1.017], [-0.069, 1.010], [-0.064, 1.005],
[-0.048, 1.005], [-0.031, 1.005], [-0.031, 0.996], [-0.040, 0.987],
[-0.045, 0.980], [-0.052, 0.975], [-0.040, 0.973], [-0.026, 0.968],
[-0.020, 0.954], [-0.006, 0.947], [0.003, 0.935], [0.006, 0.926],
[0.005, 0.921], [0.022, 0.923], [0.033, 0.912], [0.029, 0.905],
[0.017, 0.900], [0.012, 0.895], [0.027, 0.893], [0.019, 0.886],
[0.001, 0.883], [-0.012, 0.884], [-0.029, 0.883], [-0.038, 0.879],
[-0.057, 0.881], [-0.062, 0.876], [-0.078, 0.876], [-0.087, 0.872],
[-0.030, 0.907], [-0.007, 0.905], [-0.057, 0.916], [-0.025, 0.933],
[-0.077, 0.990], [-0.059, 0.993]])
# Make lats + lons
x = abs(xy[:, 0] * 180 / 3.14159)
y = xy[:, 1] * 180 / 3.14159
# A selected triangulation of the points.
triangles = np.asarray([
[67, 66, 1], [65, 2, 66], [1, 66, 2], [64, 2, 65], [63, 3, 64],
[60, 59, 57], [2, 64, 3], [3, 63, 4], [0, 67, 1], [62, 4, 63],
[57, 59, 56], [59, 58, 56], [61, 60, 69], [57, 69, 60], [4, 62, 68],
[6, 5, 9], [61, 68, 62], [69, 68, 61], [9, 5, 70], [6, 8, 7],
[4, 70, 5], [8, 6, 9], [56, 69, 57], [69, 56, 52], [70, 10, 9],
[54, 53, 55], [56, 55, 53], [68, 70, 4], [52, 56, 53], [11, 10, 12],
[69, 71, 68], [68, 13, 70], [10, 70, 13], [51, 50, 52], [13, 68, 71],
[52, 71, 69], [12, 10, 13], [71, 52, 50], [71, 14, 13], [50, 49, 71],
[49, 48, 71], [14, 16, 15], [14, 71, 48], [17, 19, 18], [17, 20, 19],
[48, 16, 14], [48, 47, 16], [47, 46, 16], [16, 46, 45], [23, 22, 24],
[21, 24, 22], [17, 16, 45], [20, 17, 45], [21, 25, 24], [27, 26, 28],
[20, 72, 21], [25, 21, 72], [45, 72, 20], [25, 28, 26], [44, 73, 45],
[72, 45, 73], [28, 25, 29], [29, 25, 31], [43, 73, 44], [73, 43, 40],
[72, 73, 39], [72, 31, 25], [42, 40, 43], [31, 30, 29], [39, 73, 40],
[42, 41, 40], [72, 33, 31], [32, 31, 33], [39, 38, 72], [33, 72, 38],
[33, 38, 34], [37, 35, 38], [34, 38, 35], [35, 37, 36]])
z = np.random.uniform(0, 16, 74)
# print("x",x)
# print("y",y)
# print("z",z)
def plotthis(z, regions='w'):
if regions is 'O':
z = np.where(((x >= 0) & (x <= 4) & (y >= 50) & (y <= 56)), z, np.nan).flatten()
elif regions is 'A':
z = np.where(((x >= 3) & (x <= 4) & (y >= 54) & (y <= 57)), z, np.nan).flatten()
elif regions is 'T':
z = np.where(((x >= -2) & (x <= 3) & (y >= 50) & (y <= 57)), z, np.nan).flatten()
# else:
# # data = get_data4region(data,**odisha)
# z=z.flatten()
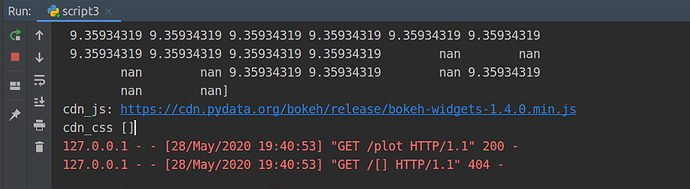
print("lx:", len(x), "ly:", len(y), "lz:", len(z))
print("z", z)
verts = pd.DataFrame(np.stack((x, y, z)).T, columns=['X', 'Y', 'Z'])
# #openStreet Background.
# tri_sub = cf.apply(lambda x: x - 1)
# tri_sub=tri_sub[:10]
tri = gv.TriMesh((triangles, gv.Points(verts)))
return tri
allplot = {(k, r): plotthis(k, r) for k, r in zip(z, ['O', 'A', 'T'])}
df_div = hv.Div("""
<figure>
<img src="https://i.ibb.co/5h74S9n/python.png" height='80' width='90' vspace='-10'>
""")
colorbar_opts = {
'major_label_overrides': {
0: '0',
1: '1',
2: '2',
3: '3',
4: '4',
5: '5',
6: '6',
7: '7',
8: '8',
9: '9',
10: '10',
11: '11',
12: '12',
13: '13',
14: '>14',
15: '15'
},
'major_label_text_align': 'left', 'major_label_text_font_style': 'bold', }
logo1 = hv.RGB.load_image("https://i.ibb.co/5h74S9n/python.png")
def absolute_position(plot, element):
glyph = plot.handles['glyph']
x_range, y_range = plot.handles['x_range'], plot.handles['y_range']
glyph.dh_units = 'screen'
glyph.dw_units = 'screen'
glyph.dh = 60
glyph.dw = 90
glyph.x = x_range.start
glyph.y = y_range.start
xcode = CustomJS(code="glyph.x = cb_obj.start", args={'glyph': glyph})
plot.handles['x_range'].js_on_change('start', xcode)
ycode = CustomJS(code="glyph.y = cb_obj.start", args={'glyph': glyph})
plot.handles['y_range'].js_on_change('start', ycode)
def plot_limits(plot, element):
plot.handles['x_range'].min_interval = 100
plot.handles['x_range'].max_interval = 55000000
# 3000000
plot.handles['y_range'].min_interval = 500
plot.handles['y_range'].max_interval = 900000
opts = dict(width=700, height=700, tools=['hover', 'save', 'wheel_zoom'], active_tools=['wheel_zoom'],
hooks=[plot_limits], colorbar=True, color_levels=15,
colorbar_opts=colorbar_opts, cmap=['#000080',
'#0000cd',
'#0008ff',
'#004cff',
'#0090ff',
'#00d4ff',
'#29ffce',
'#60ff97',
'#97ff60',
'#ceff29',
'#ffe600',
'#ffa700',
'#ff2900',
'#cd0000',
'#800000',
], clim=(0, 15), title="\t\t\t\t\t\t\t\t\t Mean Period (s) ",
fontsize={'title': 18, 'xlabel': 15, 'ylabel': 15, 'ticks': 12})
tiles = gv.tile_sources.Wikipedia
hmap1 = hv.HoloMap(allplot, kdims=['Select D :', 'Select State'])
dd = df_div.opts(width=70, height=70)
finalplot = pn.Column(pn.Row(dd), tiles * rasterize(hmap1).options(**opts) * logo1.opts(hooks=[absolute_position],
apply_ranges=False))
from bokeh.embed import components
from bokeh.resources import CDN
from bokeh.io import curdoc
doc = curdoc()
script, div = components(finalplot.get_root(doc))
cdn_js0=CDN.js_files[0]
cdn_js = CDN.js_files[1]
cdn_css=CDN.css_files
print("cdn_js:",cdn_js)
print("cdn_css",cdn_css)
return render_template("plot.html",
script=script,
div=div,
cdn_css=cdn_css,
cdn_js=cdn_js,
cdn_js0=cdn_js0)
@app.route('/')
def home():
return render_template("home.html")
@app.route('/about/')
def about():
return render_template("about.html")
if __name__=='__main__':
app.run(debug=True)
plot.html below
{%extends "layout.html"%}
{%block content%}
<link rel="stylesheet" href={{cdn_css | safe}} type="text/css" />
<script type="text/javascript" src={{cdn_js0 | safe}}></script>
<script type="text/javascript" src={{cdn_js | safe}}></script>
<div class="about">
    <h1>This is Webplot page</h1>
    <p>This is a test website again</p>
</div>
{{script | safe}}
{{div | safe}}
{%endblock%}
below is layout.html
<!DOCTYPE html>
<html>
  <head>
      <title>Flask App</title>
      <link rel="stylesheet" href="{{url_for('static',filename='css/main.css')}}"
  </head>
  <body>
    <header>
      <div class="container">
        <h1 class="logo">Web Application</h1>
        <strong><nav>
          <ul class="menu">
            <li><a href="{{ url_for('home') }}">Home</a></li>
            <li><a href="{{ url_for('about') }}">About</a></li>
            <li><a href="{{ url_for('plot') }}">Plot</a></li>
          </ul>
        </nav></strong>
      </div>
    </header>
    <div class="container">
        {%block content%}
        {%endblock%}
    </div>
  </body>
</html>
output plot of java console is below .
we can see in output embedded plot, plot is static in nature
I will be really grateful & appreciate your this help .
why plot is not dynamic in nature when we are embedding in flask nor osm map is working
How i can modify the bokeh document so that dropdown work fine.
Thank you.