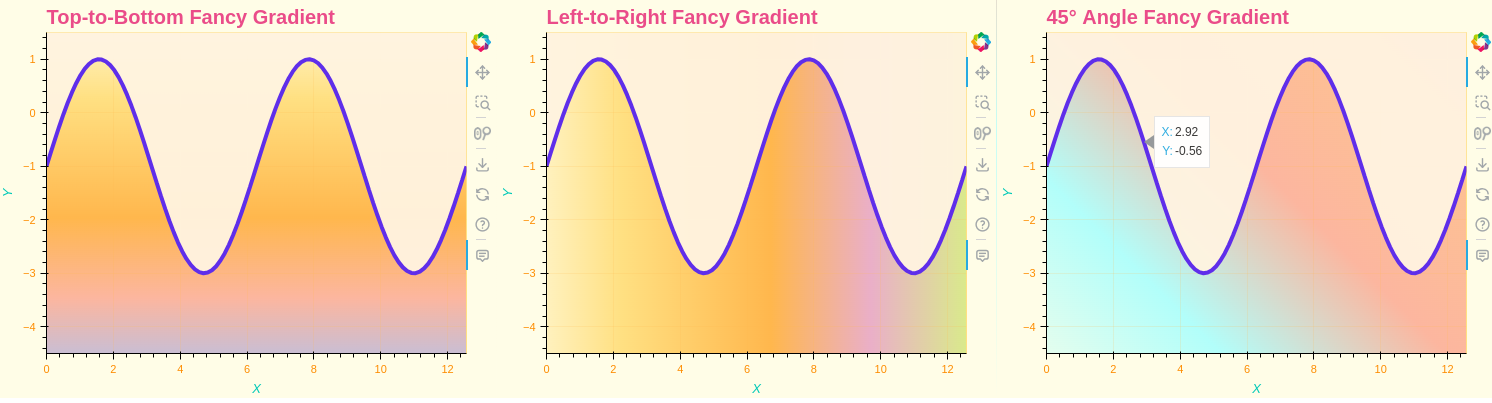
A try for Bar plot!
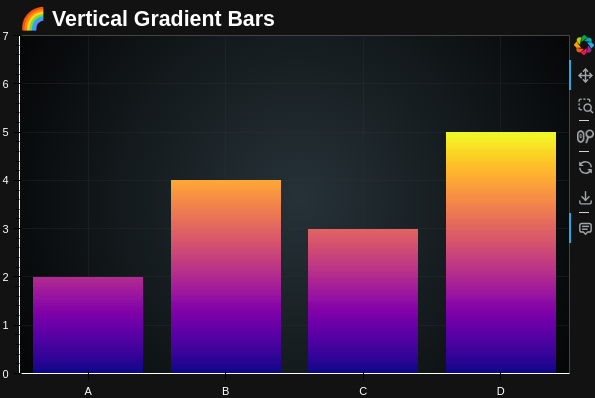
A. Using colormap:
import numpy as np
from bokeh.plotting import figure, show
from bokeh.models import ColumnDataSource, HoverTool, InlineStyleSheet, FixedTicker
from bokeh.layouts import column
import matplotlib.cm as cm

# Data
categories = ['A', 'B', 'C', 'D']
values = [2, 4, 3, 5]
num_bars = len(values)
bar_width = 0.8
image_height = 100

x_numeric = np.arange(num_bars)
max_val = max(values)

# Create figure
p = figure(
    width=600, height=400,
    x_range=(-0.5, num_bars - 0.5),
    y_range=(0, max_val + 2),
    title="🌈 Vertical Gradient Bars",
    tools="pan,wheel_zoom,box_zoom,reset,save",
    toolbar_location="right"
)

rgba_images = []
for val in values:
    frac = val / max_val
    h_px = max(1, int(frac * image_height))  # Height in px for this bar
    gradient = np.linspace(0, frac, h_px)
    colors = (cm.get_cmap('plasma')(gradient)[:, :3] * 255).astype(np.uint8)

    rgba = np.zeros((image_height, 20, 4), dtype=np.uint8)
    if h_px > 0:
        rgba[:h_px, :, :3] = colors[:, None, :]        # Fill from bottom pixel up!
        rgba[:h_px, :, 3] = 255
    # The top stays transparent!

    # No flipud!
    packed = rgba.view(dtype=np.uint32).reshape((image_height, 20))
    rgba_images.append(packed)

# Draw bars, all bottom-aligned at y=0, growing up
dw = bar_width
dh = max_val
for i in range(num_bars):
    p.image_rgba(
        image=[rgba_images[i]],
        x=[i - dw / 2],  # center on tick
        y=[0],           # always starts at y=0!
        dw=dw,
        dh=dh
    )

# Invisible vbars for hover
source = ColumnDataSource(data=dict(
    x=x_numeric,
    top=values,
    tooltip=[f"Category: {cat}<br>Value: {val}" for cat, val in zip(categories, values)]
))
p.vbar(
    x='x',
    top='top',
    width=bar_width,
    source=source,
    fill_alpha=0,
    line_alpha=0,
    name="bars"
)

hover = HoverTool(
    tooltips="@tooltip",
    mode='vline',
    name="bars"
)
p.add_tools(hover)

# Set tick labels and style
p.xaxis.ticker = FixedTicker(ticks=list(x_numeric))
p.xaxis.major_label_overrides = {i: cat for i, cat in enumerate(categories)}
p.xaxis.major_label_text_color = "white"
p.title.text_color = "white"
p.title.text_font_size = "16pt"
p.yaxis.major_label_text_color = "white"
p.xaxis.axis_line_color = "white"
p.yaxis.axis_line_color = "white"
p.yaxis.axis_label_text_color = "white"
p.xaxis.axis_label_text_color = "white"
p.background_fill_color = None
p.border_fill_color = "#121212"
p.outline_line_color = "#444"
p.grid.grid_line_color = "#333"
p.grid.grid_line_alpha = 0.3

gradient_css = InlineStyleSheet(css="""
:host {
  background: radial-gradient(circle at center, #263238 0%, #000000 100%);
}
""")

show(column(p, stylesheets=[gradient_css]))
import numpy as np
from bokeh.plotting import figure, show
from bokeh.models import ColumnDataSource, HoverTool, InlineStyleSheet, FixedTicker
from bokeh.layouts import column
import matplotlib.cm as cm
# Data
categories = ['A', 'B', 'C', 'D']
values = [2, 4, 3, 5]
num_bars = len(values)
bar_height = 0.8
image_width = 100 # max gradient resolution
# Use numeric y
y_numeric = np.arange(num_bars)
# Figure
p = figure(
width=600, height=400,
y_range=(-0.5, num_bars - 0.5),
x_range=(0, max(values) + 2),
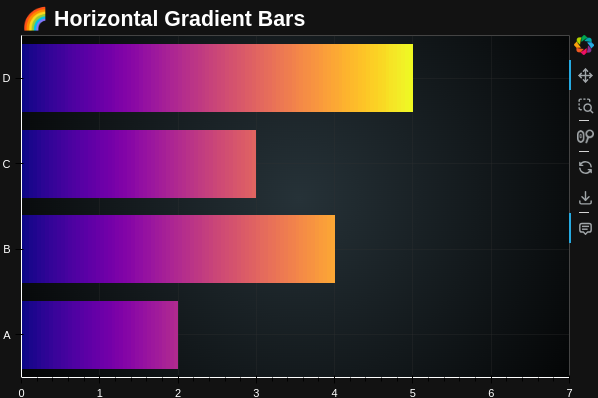
title="🌈 Horizontal Gradient Bars",
tools="pan,wheel_zoom,box_zoom,reset,save",
toolbar_location="right"
)
rgba_images = []
for val in values:
# Compute how much of the colorbar to use for this bar
frac = val / max(values)
w_px = max(1, int(frac * image_width)) # at least 1px wide!
gradient = np.linspace(0, frac, w_px)
colors = (cm.get_cmap('plasma')(gradient)[:, :3] * 255).astype(np.uint8)
# Create a blank (transparent) image, fill only left part with gradient
rgba = np.zeros((20, image_width, 4), dtype=np.uint8)
if w_px > 0:
rgba[:, :w_px, :3] = colors[None, :, :]
rgba[:, :w_px, 3] = 255 # fully opaque
# The rest stays transparent/black
packed = rgba.view(dtype=np.uint32).reshape((20, image_width))
rgba_images.append(packed)
# Draw bars: each with their own partial colorbar
dh = bar_height
dw = max(values) # Each image always spans max value width, but only part is filled
for i in range(num_bars):
p.image_rgba(
image=[rgba_images[i]],
x=[0],
y=[i - dh / 2],
dw=dw,
dh=dh
)
# Overlay invisible hbars for hover interactivity
source = ColumnDataSource(data=dict(
y=y_numeric,
right=values,
tooltip=[f"Category: {cat}<br>Value: {val}" for cat, val in zip(categories, values)]
))
p.hbar(
y='y',
right='right',
height=bar_height,
source=source,
fill_alpha=0,
line_alpha=0,
name="bars"
)
hover = HoverTool(
tooltips="@tooltip",
mode='hline',
name="bars"
)
p.add_tools(hover)
# Set category names as y-tick labels at integer positions
p.yaxis.ticker = FixedTicker(ticks=list(y_numeric))
p.yaxis.major_label_overrides = {i: cat for i, cat in enumerate(categories)}
p.yaxis.major_label_text_color = "white"
# Dark theme styling
p.title.text_color = "white"
p.title.text_font_size = "16pt"
p.xaxis.major_label_text_color = "white"
p.xaxis.axis_line_color = "white"
p.yaxis.axis_line_color = "white"
p.yaxis.axis_label_text_color = "white"
p.xaxis.axis_label_text_color = "white"
p.background_fill_color = None
p.border_fill_color = "#121212"
p.outline_line_color = "#444"
p.grid.grid_line_color = "#333"
p.grid.grid_line_alpha = 0.3
gradient_css = InlineStyleSheet(css="""
:host {
background: radial-gradient(circle at center, #263238 0%, #000000 100%);
}
""")
show(column(p, stylesheets=[gradient_css]))
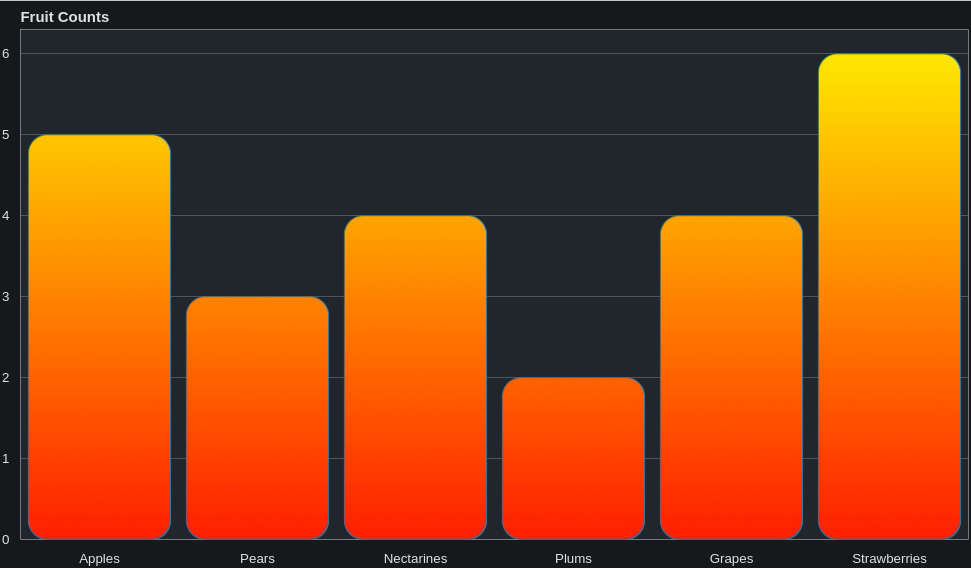
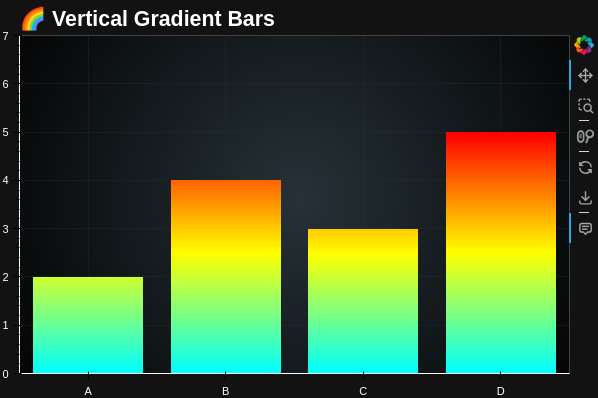
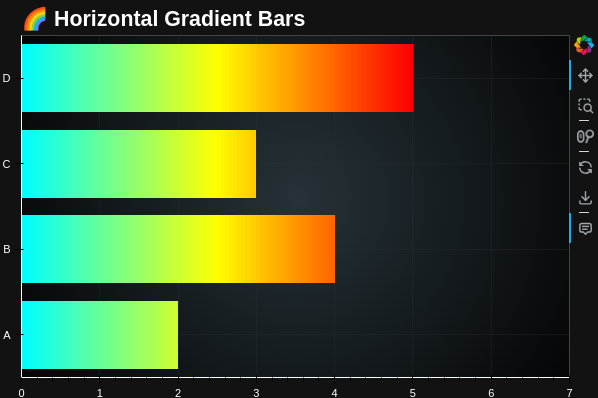
B. With custom colors:
import numpy as np
from bokeh.plotting import figure, show
from bokeh.models import ColumnDataSource, HoverTool, InlineStyleSheet, FixedTicker
from bokeh.layouts import column

# Data
categories = ['A', 'B', 'C', 'D']
values = [2, 4, 3, 5]
num_bars = len(values)
bar_width = 0.8
image_height = 100

x_numeric = np.arange(num_bars)
max_val = max(values)

# Define custom colors: Cyan -> Yellow -> Red
color_stops = np.array([
    [0, 255, 255],   # Cyan
    [255, 255, 0],   # Yellow
    [255, 0, 0],     # Red
])

def custom_gradient(gradient, color_stops):
    positions = np.linspace(0, 1, len(color_stops))
    reds   = np.interp(gradient, positions, color_stops[:, 0])
    greens = np.interp(gradient, positions, color_stops[:, 1])
    blues  = np.interp(gradient, positions, color_stops[:, 2])
    return np.stack([reds, greens, blues], axis=1).astype(np.uint8)

# Create figure
p = figure(
    width=600, height=400,
    x_range=(-0.5, num_bars - 0.5),
    y_range=(0, max_val + 2),
    title="🌈 Vertical Gradient Bars",
    tools="pan,wheel_zoom,box_zoom,reset,save",
    toolbar_location="right"
)

rgba_images = []
for val in values:
    frac = val / max_val
    h_px = max(1, int(frac * image_height))
    gradient = np.linspace(0, frac, h_px)
    colors = custom_gradient(gradient, color_stops)

    rgba = np.zeros((image_height, 20, 4), dtype=np.uint8)
    if h_px > 0:
        rgba[:h_px, :, :3] = colors[:, None, :]
        rgba[:h_px, :, 3] = 255
    packed = rgba.view(dtype=np.uint32).reshape((image_height, 20))
    rgba_images.append(packed)

dw = bar_width
dh = max_val
for i in range(num_bars):
    p.image_rgba(
        image=[rgba_images[i]],
        x=[i - dw / 2],
        y=[0],
        dw=dw,
        dh=dh
    )

# Invisible vbars for hover
source = ColumnDataSource(data=dict(
    x=x_numeric,
    top=values,
    tooltip=[f"Category: {cat}<br>Value: {val}" for cat, val in zip(categories, values)]
))
p.vbar(
    x='x',
    top='top',
    width=bar_width,
    source=source,
    fill_alpha=0,
    line_alpha=0,
    name="bars"
)

hover = HoverTool(
    tooltips="@tooltip",
    mode='vline',
    name="bars"
)
p.add_tools(hover)

# Set tick labels and style
p.xaxis.ticker = FixedTicker(ticks=list(x_numeric))
p.xaxis.major_label_overrides = {i: cat for i, cat in enumerate(categories)}
p.xaxis.major_label_text_color = "white"
p.title.text_color = "white"
p.title.text_font_size = "16pt"
p.yaxis.major_label_text_color = "white"
p.xaxis.axis_line_color = "white"
p.yaxis.axis_line_color = "white"
p.yaxis.axis_label_text_color = "white"
p.xaxis.axis_label_text_color = "white"
p.background_fill_color = None
p.border_fill_color = "#121212"
p.outline_line_color = "#444"
p.grid.grid_line_color = "#333"
p.grid.grid_line_alpha = 0.3

gradient_css = InlineStyleSheet(css="""
:host {
  background: radial-gradient(circle at center, #263238 0%, #000000 100%);
}
""")

show(column(p, stylesheets=[gradient_css]))
import numpy as np
from bokeh.plotting import figure, show
from bokeh.models import ColumnDataSource, HoverTool, InlineStyleSheet, FixedTicker
from bokeh.layouts import column

# Data
categories = ['A', 'B', 'C', 'D']
values = [2, 4, 3, 5]
num_bars = len(values)
bar_height = 0.8
image_width = 100  # horizontal resolution

y_numeric = np.arange(num_bars)
max_val = max(values)

# Define custom colors: Cyan -> Yellow -> Red
color_stops = np.array([
    [0, 255, 255],   # Cyan
    [255, 255, 0],   # Yellow
    [255, 0, 0],     # Red
])

def custom_gradient(gradient, color_stops):
    positions = np.linspace(0, 1, len(color_stops))
    reds   = np.interp(gradient, positions, color_stops[:, 0])
    greens = np.interp(gradient, positions, color_stops[:, 1])
    blues  = np.interp(gradient, positions, color_stops[:, 2])
    return np.stack([reds, greens, blues], axis=1).astype(np.uint8)

# Create figure
p = figure(
    width=600, height=400,
    y_range=(-0.5, num_bars - 0.5),
    x_range=(0, max_val + 2),
    title="🌈 Horizontal Gradient Bars",
    tools="pan,wheel_zoom,box_zoom,reset,save",
    toolbar_location="right"
)

rgba_images = []
for val in values:
    frac = val / max_val
    w_px = max(1, int(frac * image_width))
    gradient = np.linspace(0, frac, w_px)
    colors = custom_gradient(gradient, color_stops)

    rgba = np.zeros((20, image_width, 4), dtype=np.uint8)
    if w_px > 0:
        rgba[:, :w_px, :3] = colors[None, :, :]
        rgba[:, :w_px, 3] = 255
    packed = rgba.view(dtype=np.uint32).reshape((20, image_width))
    rgba_images.append(packed)

dw = max_val
dh = bar_height
for i in range(num_bars):
    p.image_rgba(
        image=[rgba_images[i]],
        x=[0],
        y=[i - dh / 2],
        dw=dw,
        dh=dh
    )

# Invisible hbars for hover
source = ColumnDataSource(data=dict(
    y=y_numeric,
    right=values,
    tooltip=[f"Category: {cat}<br>Value: {val}" for cat, val in zip(categories, values)]
))
p.hbar(
    y='y',
    right='right',
    height=bar_height,
    source=source,
    fill_alpha=0,
    line_alpha=0,
    name="bars"
)

hover = HoverTool(
    tooltips="@tooltip",
    mode='hline',
    name="bars"
)
p.add_tools(hover)

# Set tick labels and style
p.yaxis.ticker = FixedTicker(ticks=list(y_numeric))
p.yaxis.major_label_overrides = {i: cat for i, cat in enumerate(categories)}
p.yaxis.major_label_text_color = "white"
p.title.text_color = "white"
p.title.text_font_size = "16pt"
p.xaxis.major_label_text_color = "white"
p.xaxis.axis_line_color = "white"
p.yaxis.axis_line_color = "white"
p.yaxis.axis_label_text_color = "white"
p.xaxis.axis_label_text_color = "white"
p.background_fill_color = None
p.border_fill_color = "#121212"
p.outline_line_color = "#444"
p.grid.grid_line_color = "#333"
p.grid.grid_line_alpha = 0.3

gradient_css = InlineStyleSheet(css="""
:host {
  background: radial-gradient(circle at center, #263238 0%, #000000 100%);
}
""")

show(column(p, stylesheets=[gradient_css]))