I’m drawing a graph using two types: a line graph and a circle graph. I have completed the graph
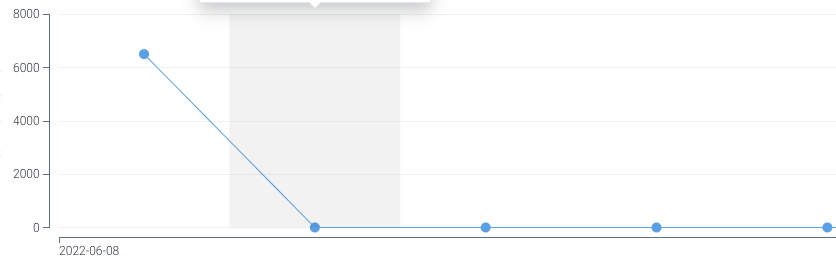
and I hope that the area will be highlighted in the graph as shown in the following picture when I put the mouse on the graph. Is there a way?
Hey @tp7019 absolutely you can accomplish this, but more detail is needed.
Do you want the same area to “highlight” when the user mouses anywhere in the figure? Or do you want it to highlight only when they mouse over the specific area? Or do you want the highlighted area to move based on where the user mouses?
Yes, you can use a mousemove event and CustomJS to accomplish this. The idea is to make a Rect glyph/renderer and update the ColumnDataSource driving it based on the user’s mouse movement:
import numpy as np
from bokeh.plotting import figure, show, save
from bokeh.models import Rect, ColumnDataSource, CustomJS

#make the figure and plot your stuff
f = figure()
dsrc = ColumnDataSource(data={'x':np.random.random(50)*100,'y':np.random.random(50)*100})
r = f.scatter(x='x',y='y',source=dsrc)

#tell the figure's dataranges to only follow your data and no other renderers
#(i.e. we don't want the figure's x/y range to adjust based on the highlight area )
f.x_range.renderers = [r]
f.y_range.renderers = [r]

#make a cds for the "highlight", initialized with empty lists
rdata={'x':[],'y':[],'w':[],'h':[]}
rsrc = ColumnDataSource(rdata)
#make a rect glyph running off the fields in this src, with properties to make it look "highlighty"
rectglyph = Rect(x='x',y='y',width='w',height='h',fill_color='grey',fill_alpha=0.2)
#generate the renderer driving off rsrc
rectrend = f.add_glyph(source_or_glyph=rsrc,glyph=rectglyph)
#callback to trigger on mousemove event within the figure:
    #when triggered, retrieve the mouse's x and y position (cb_obj.x and cb_obj.y)
    #update the source driving the highlight glyph accordingly
#hard coded in width and height here but you could easily add sliders or something to make that user-adjustable as well
cb = CustomJS(args=dict(rsrc=rsrc)
              ,code='''
              rsrc.data = {'x':[cb_obj.x],'y':[cb_obj.y],'w':[10],'h':[10]}
              rsrc.change.emit()
              ''')
#assign this callback to occur on mousemove
f.js_on_event('mousemove',cb)
#final callback, we want to "reset" rsrc when the user's mouse leaves the figure
#this will make the highlight area "disapear" when the mouse leaves
f.js_on_event('mouseleave',CustomJS(args=dict(rsrc=rsrc,rdata=rdata)
                                    ,code='''
                                    rsrc.data=rdata
                                    rsrc.change.emit()
                                    '''))
show(f)
It’s’ not clear from the question: does the highlight box need to follow the mouse? Or is there “tiling” of regions, and the mouse movement causes one of the fixed tiles underneath to show?
If the latter, and plot does not need to be zoomed out [1], another idea is to add a rect/vbar/etc glyph on top of the others. Its normal state would be invisible (i.e. alpha=0) but its hover state would be visible.
it would still work zoomed out, just at some point you’d be able to see the tops/bottoms of the rects, and that might not be desirable. ↩︎
@tp7019 FWIW you can definitely also use the general technique that @gmerritt123 demonstrated to accomplish the “tiled” case as well (you would need to compute the tile coordinates from the current mouse position instead of just centering on the mouse unconditionally).