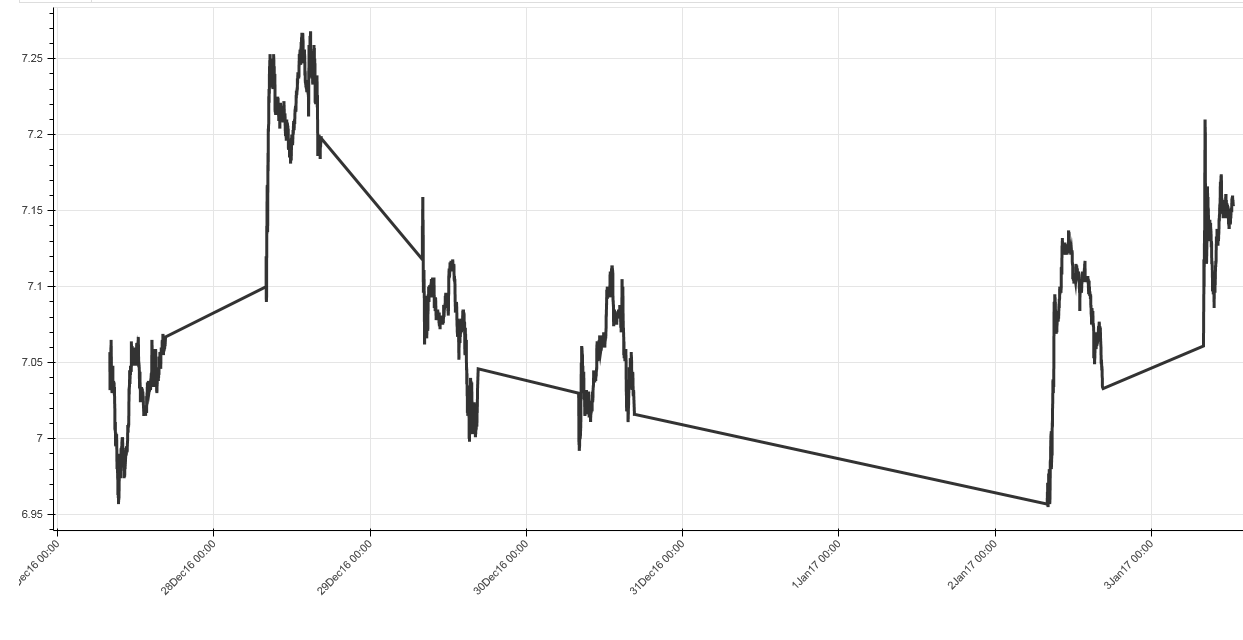
I have been ploting timeseries using the below and I get a nice result but I would like to know if there is an easy way to avoid having non business day on the xaxis as it is creating some horizontal line as per
the attachment.
Thanks again for any help you can provide and for that wonderful tool that bokeh is.
Thanks a lot.
I checked my data. The 31rst of December and the the first of January were closed and I have no data for those days so it is all good but in bokeh I see those 2 days.
Is it because I am using x_axis_type=“datetime”? Is there a way around that ?
I’m not sure if I understand correctly (I’m the same guy as above btw).
But 1st of Jan and 31st of Dec show up in your plot despite the fact that they are not in your df?
That’s kind of odd… I run a time series with the x_axis_type=“datetime” and it doesn’t do that. It just starts at the first date df and ends with the last date of the df.
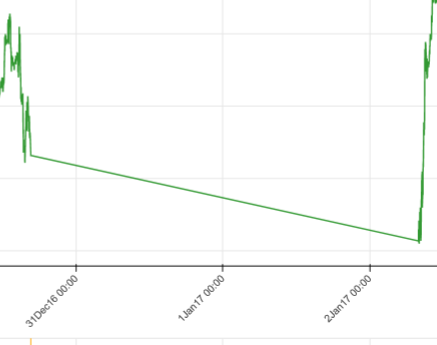
btw I don’t understand why you show Jan 2nd and Dec 30th data? =P
I'm not sure if I understand correctly (I'm the same guy as above btw).
But 1st of Jan and 31st of Dec show up in your plot despite the fact that they are not in your df?
That's kind of odd.. I run a time series with the x_axis_type="datetime" and it doesn't do that. It just starts at the first date df and ends with the last date of the df.
btw I don't understand why you show Jan 2nd and Dec 30th data? =P
Exactly they are not in my df(see attached).
I showed you the date to prove my point as they are sorted so I jumped from 30th Dec to 2nd of January in my df but in the graph I have them on the x_axis
Could it be linked to the fact I am loading that df and using source.stream(data) or the formatting ?
I’m not sure if I understand correctly (I’m the same guy as above btw).
But 1st of Jan and 31st of Dec show up in your plot despite the fact that they are not in your df?
That’s kind of odd… I run a time series with the x_axis_type=“datetime” and it doesn’t do that. It just starts at the first date df and ends with the last date of the df.
btw I don’t understand why you show Jan 2nd and Dec 30th data? =P
–
You received this message because you are subscribed to the Google Groups “Bokeh Discussion - Public” group.
To unsubscribe from this group and stop receiving emails from it, send an email to [email protected].
Line just joins up every pair of adjacent points, it has no notion of separation based on "distance" between points. Options are basically:
* You can "split" a line with nans
* You can use multi_line or mulitple line calls to draw separate lines
* You can reindex somehow and use a custom ticker (the example I linked in the other post)
Thanks,
Bryan
···
On Jan 3, 2017, at 8:49 AM, Patrick Houel <[email protected]> wrote:
Exactly they are not in my df(see attached).
I showed you the date to prove my point as they are sorted so I jumped from 30th Dec to 2nd of January in my df but in the graph I have them on the x_axis
Could it be linked to the fact I am loading that df and using source.stream(data) or the formatting ?
On Tue, Jan 3, 2017 at 2:40 PM, <[email protected]> wrote:
I'm not sure if I understand correctly (I'm the same guy as above btw).
But 1st of Jan and 31st of Dec show up in your plot despite the fact that they are not in your df?
That's kind of odd.. I run a time series with the x_axis_type="datetime" and it doesn't do that. It just starts at the first date df and ends with the last date of the df.
btw I don't understand why you show Jan 2nd and Dec 30th data? =P
--
--
Patrick Houel
96, Kensington High Street
London, W8 4SG
W London : +44-203-66-78763
W New-York :+1- 646-979-4838
M: +44-753-02-12963 [email protected]
I showed you the date to prove my point as they are sorted so I jumped from 30th Dec to 2nd of January in my df but in the graph I have them on the x_axis
Could it be linked to the fact I am loading that df and using source.stream(data) or the formatting ?
I’m not sure if I understand correctly (I’m the same guy as above btw).
But 1st of Jan and 31st of Dec show up in your plot despite the fact that they are not in your df?
That’s kind of odd… I run a time series with the x_axis_type=“datetime” and it doesn’t do that. It just starts at the first date df and ends with the last date of the df.
btw I don’t understand why you show Jan 2nd and Dec 30th data? =P
–
You received this message because you are subscribed to the Google Groups “Bokeh Discussion - Public” group.
To unsubscribe from this group and stop receiving emails from it, send an email to [email protected].