Hello,
I cann’t find any mechanism to add grid for CategoryAxis group and subgroup levels.
Is there an idiomatic (“Bokehic”) way to solve the problem? Or is this a reason to open a new feature request?
Empirically, I have chosen a formula for calculating (emulating) grid for group-level like
x=[(lhue + 1.4)*i - 0.7 for i in range(lgroup+1)]
But it is not “infinite” (it is defined and does not redraw when the scale changes), unlike “regular” grids.
See example below
from bokeh.models import ColumnDataSource, FactorRange
from bokeh.plotting import figure, show

fruits = ['Apples', 'Pears', 'Nectarines', 'Plums', 'Grapes', 'Strawberries']
years = ['2015', '2016', '2017']

data = {'fruits' : fruits,
        '2015'   : [2, 1, 4, 3, 2, 4],
        '2016'   : [5, 3, 3, 2, 4, 6],
        '2017'   : [3, 2, 4, 4, 5, 3]}

# this creates [ ("Apples", "2015"), ("Apples", "2016"), ("Apples", "2017"), ("Pears", "2015), ... ]
x = [ (fruit, year) for fruit in fruits for year in years ]
counts = sum(zip(data['2015'], data['2016'], data['2017']), ()) # like an hstack

source = ColumnDataSource(data=dict(x=x, counts=counts))

p = figure(x_range=FactorRange(*x), height=350, title="Fruit Counts by Year",
           toolbar_location=None, tools="")

p.vbar(x='x', top='counts', width=0.9, source=source)

p.y_range.start = 0
p.x_range.range_padding = 0.1
p.xaxis.major_label_orientation = 1
p.xgrid.grid_line_color = None

# create grid for group-level
lhue = len(years)
lgroup = len(fruits)

p.vspan(
    x=[(lhue + 1.4)*i - 0.7 for i in range(lgroup+1)],
    line_width=1, line_color="lightgray",
)

show(p)
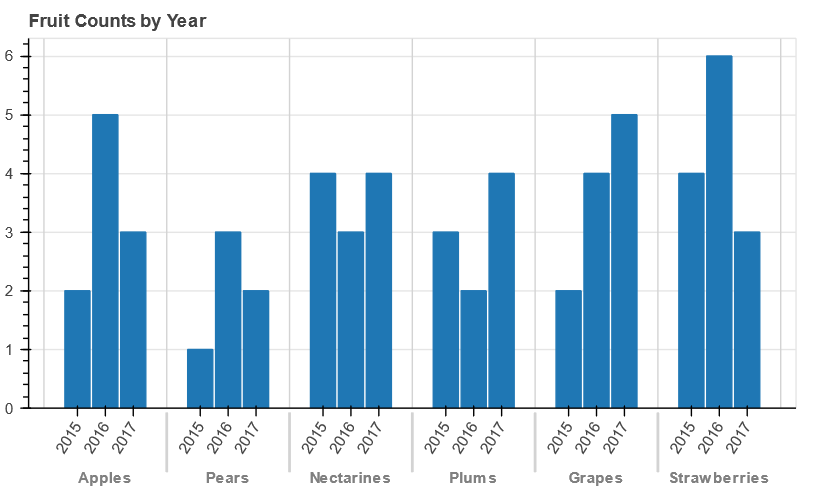
(based on Bar charts — Bokeh 3.3.2 Documentation example)