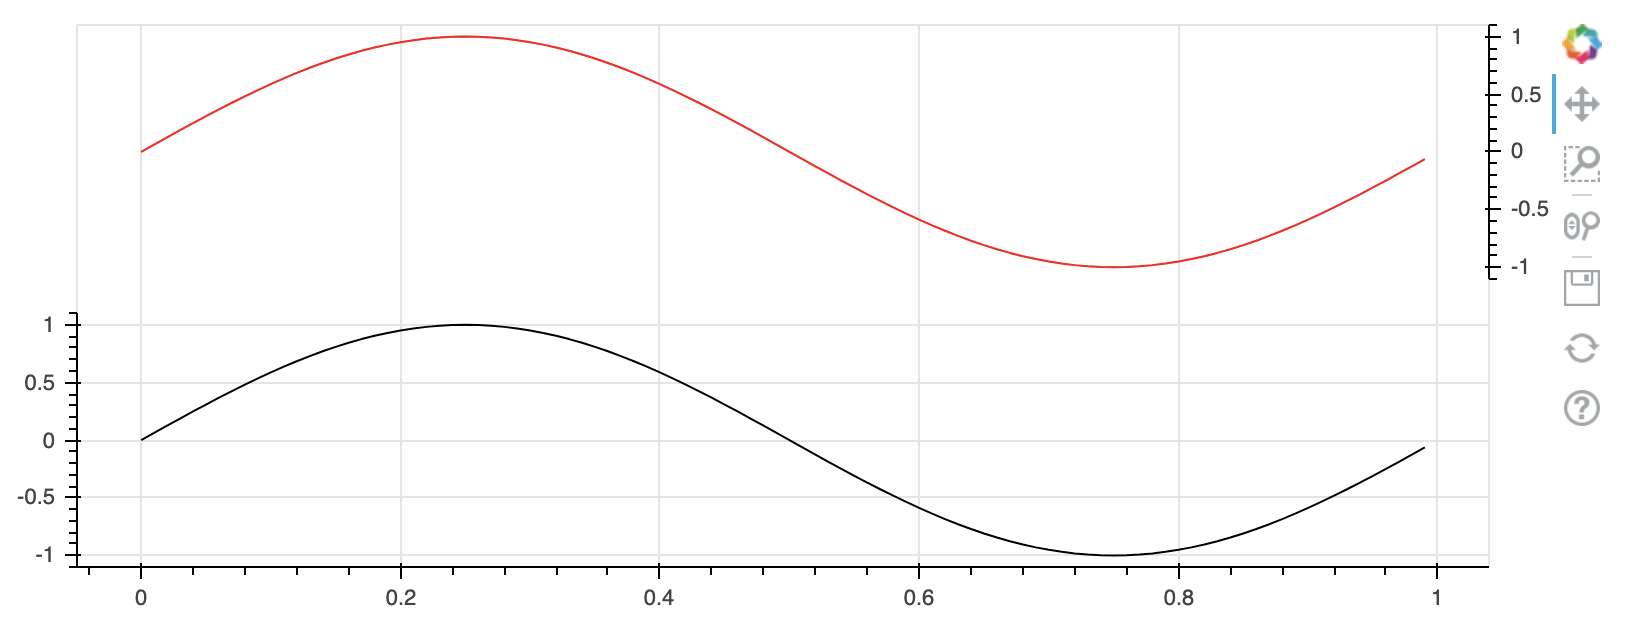
Context I want to visualize matches between two (univariate) time series via dynamic time warping. For this application, I would like to plot the signals in the same figure/plot area with a vertical offset so I can later add lines that show which points in the two signals correspond.
I can accomplish this with multiple y axes using the bounds property for each. However, I have not been able to figure out how to have gridlines associated with the second y-axis. Here’s an illustrative output of what I have and the corresponding code to generate the principal parts of the figure.
Ideas on how to add gridlines for the extra axes is appreciated. (A cursory inspection of the figures axis property shows three elements, but the grid property only has two.)
#!/usr/bin/env python3
# -*- coding: utf-8 -*-
"""
"""
import numpy as np

from bokeh.models import ColumnDataSource, Range1d, LinearAxis
from bokeh.plotting import figure
from bokeh.io import show

x = np.arange(0.0,1.0,0.01)
y = np.sin(2.0*np.pi*x)
source = ColumnDataSource(dict(x=x, y=y))

p = figure(width=800, height=300, y_range=(-1.1,3.6))
p.yaxis.bounds = (-1.1,1.1)

p.extra_y_ranges = {"ref": Range1d(start=-3.6, end=1.1)}
p.add_layout(LinearAxis(y_range_name="ref", bounds=(-1.1,1.1)), 'right')

p.line(x='x', y='y', source=source, line_color='#000000')
p.line(x='x', y='y', source=source, line_color='#ff0000', y_range_name='ref')

show(p)