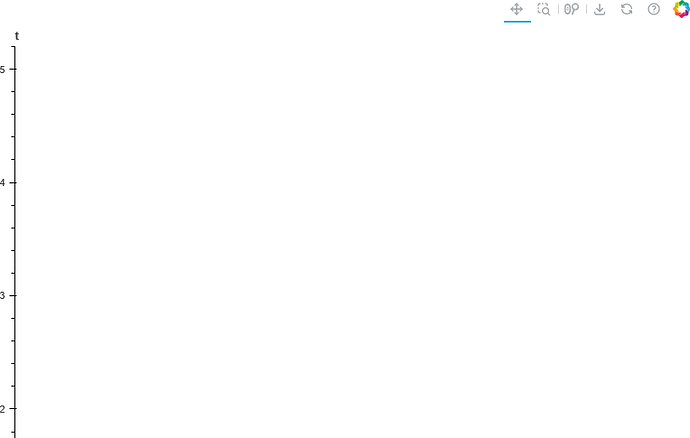
When using a layout like row or column, setting sizing_mode="stretch_width" allows for responsive resizing. However, when using gridplot, it appears that the gridpolot is responsive, but the figures inside the gridplot are set to their minimum size.
from bokeh.layouts import gridplot
from bokeh.models import ColumnDataSource
from bokeh.plotting import figure
from bokeh.server.server import Server


def render_composite_view(doc):
    source = ColumnDataSource({'x': [1, 2, 3, 4, 5], 'y': [1, 2, 3, 4, 5]})
    plot = figure(title="test plot", sizing_mode="stretch_width")
    plot.step('x', 'y', source=source)
    grid = gridplot([[plot]], sizing_mode="scale_width", )
    doc.add_root(grid)


if __name__ == '__main__':
    server = Server({'/render_composite_view': render_composite_view, },
                    allow_websocket_origin=["localhost:5000", "localhost:5006", "localhost", '*'],
                    )
    server.start()
    server.io_loop.add_callback(server.show, "/render_composite_view")
    server.io_loop.start()
