I am seeking help (and maybe attention) for an issue with gridplots.
Below you find a use case of gridplots, which has been broken in one form or another since bokeh 3.0 in 2022. Over the years, I kept on reporting back, but the issue persists.
Today I am writing here to see if anyone can tell me that I am just using gridplot wrong, or if there is some workaround. I still use variations of this and I am therefore still tied to bokeh 2.4.3. I keep wondering why this does not get more attention, because it feels like a core feature of bokeh.
I wish I could somehow contribute to help solve this, but while I feel like I am capable in python, the whole JavaScript side of things makes it difficult to even find a starting point for someone like me.
These may be related, but I am not sure:
Below is just a copy of my latest GitHub issue, but I feel like it helps to properly document my issue.
Expected behavior
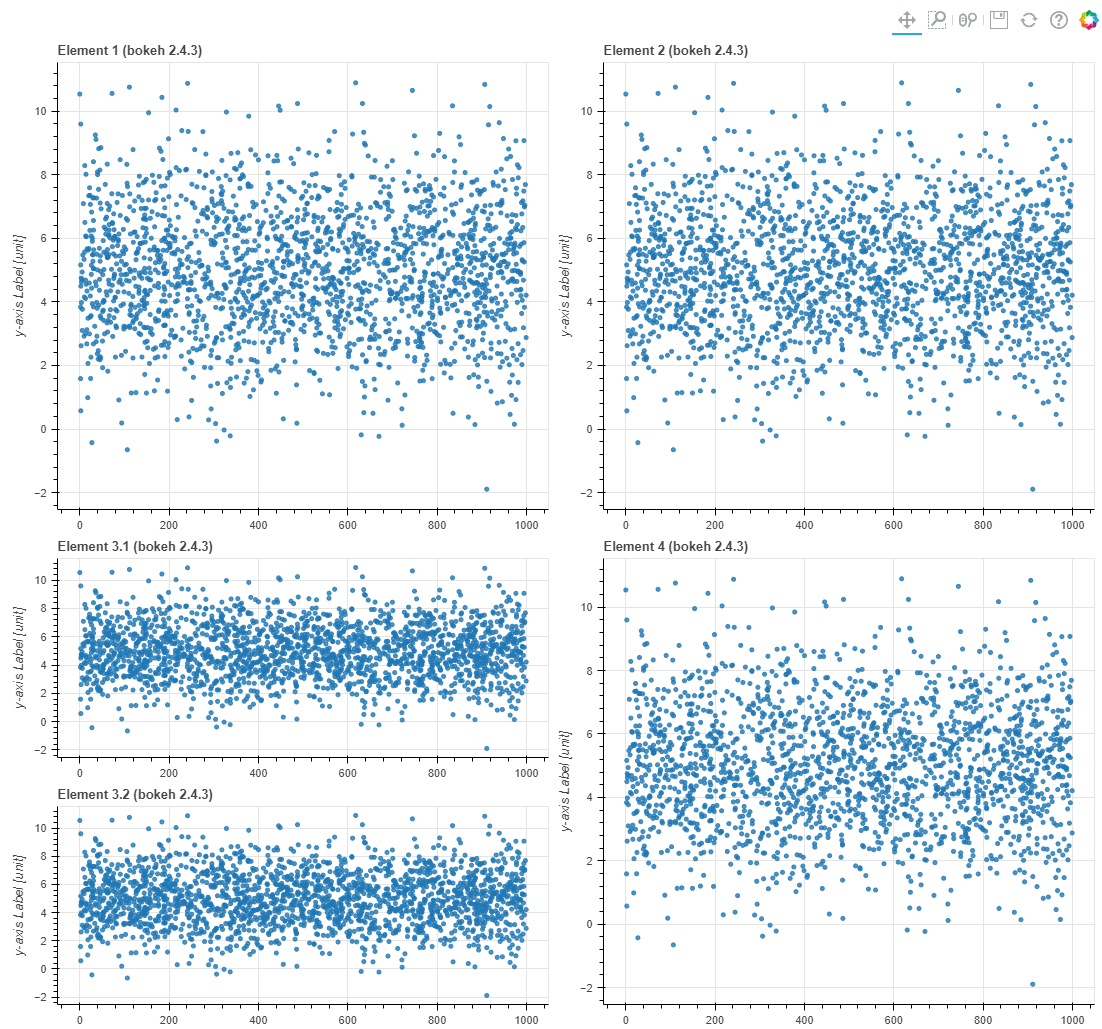
In bokeh 2.* I am able to create symmetrical gridplots, even when elements of that grid are a column of other elements.
Consider the bottom-left element, which could be a column of [plot, plot]:
I expect to be able to create those plots in bokeh 3.6.0.
Observed behavior
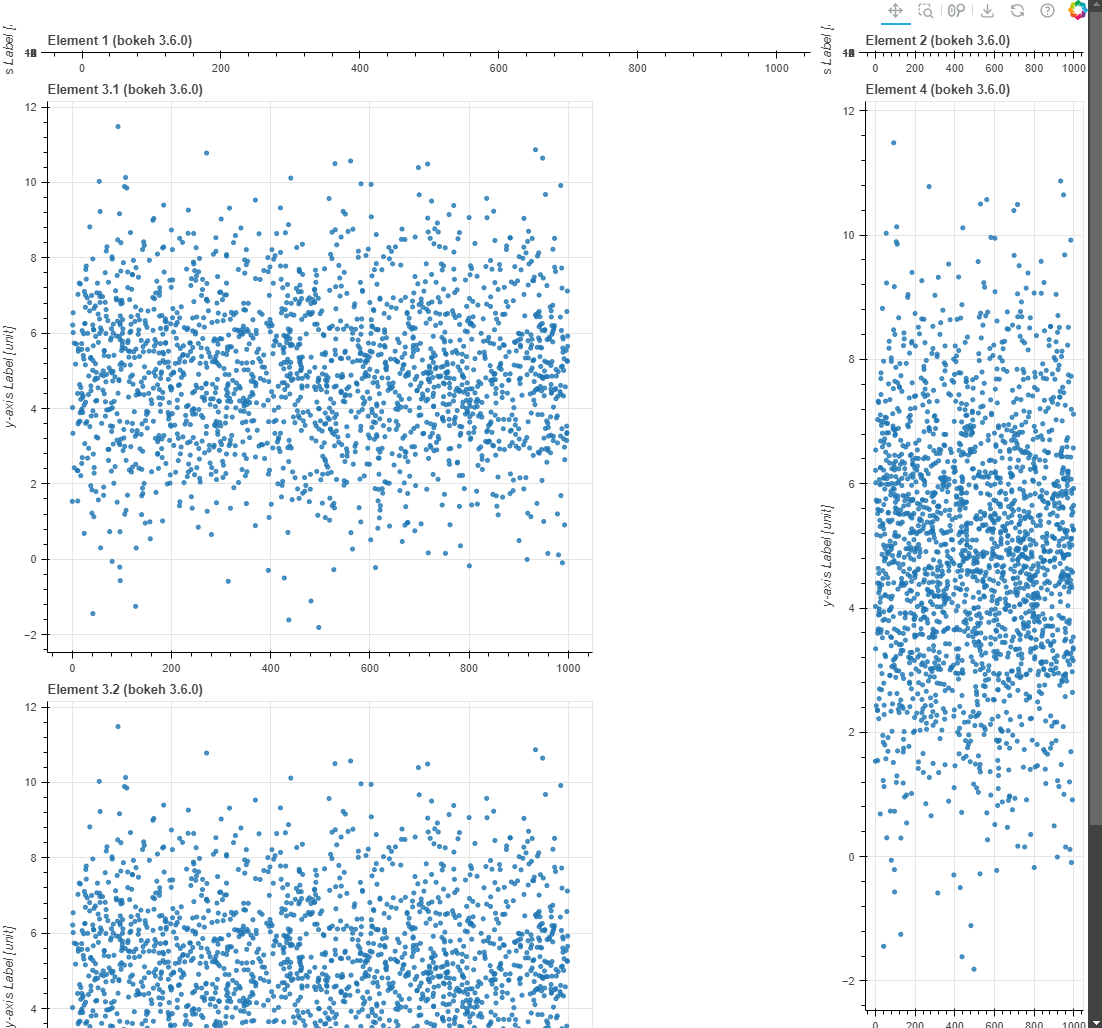
Starting from bokeh 3.0, those plots have been broken. I have tested them in each new version and they are not fixed by 3.6.0.
The plots named “Element 1” and “Element 2” have no height, and the whole layout does not scale to the browser window but requires a scroll bar.
I have previously reported this in #13241 but that did not seem to get any attention. Am I just using bokeh 3 incorrectly? I would really like to update from bokeh 2 to 3 at some point.
Example code
"""Test plotting a grid in bokeh.

The 3rd (bottom left) element in the grid is a column of two sub-elements.

In bokeh 2.* this works as intended.

In bokeh 3.6.0, stretching is not symmetrical.

This happens if the two sub-elements are e.g.:
    - plot and dropdown
    - plot and another plot
"""
import numpy as np
import bokeh
from bokeh.layouts import gridplot, column
from bokeh.models import ColumnDataSource
from bokeh.models.widgets import Select
from bokeh.plotting import figure
from bokeh.io import curdoc, show

x = np.random.random(size=2000) * 1000
y = np.random.normal(size=2000) * 2 + 5
source = ColumnDataSource(dict(x=x, y=y))

def make_plot(title):
    p = figure(title=f"Element {title} (bokeh {bokeh.__version__})")
    p.scatter('x', 'y', alpha=0.8, source=source)
    p.yaxis.axis_label = 'y-axis Label [unit]'
    return p

p1 = make_plot("1")
p2 = make_plot("2")
p3 = make_plot("3.1")
p4 = make_plot("3.2")
p5 = make_plot("4")

dropdown_graph = Select(
    title="Some other dropdown",
    value='Test', options=['Test'],
    # width=50,
    # height=50,
    # sizing_mode='fixed',  # Even setting a fixed mode does not help
    sizing_mode='stretch_width',  # Works in bokeh 2.4
    )

grid = gridplot([
    [p1, p2],
    # Option a): Works fine in Bokeh 3.6.0
    # [p3, p5],
    # Option b): Dropdown stretches too wide in Bokeh 3.6.0
    # [column([p3, dropdown_graph], sizing_mode='stretch_both'), p5],
    # Option c): Two plots are also broken in Bokeh 3.6.0
    [column([p3, p4], sizing_mode='stretch_both'), p5],
    ],
    sizing_mode='stretch_both',
    )

curdoc().add_root(grid)
curdoc().title = "Grid Test"

show(grid)
I keep wondering why this does not get more attention, because it feels like a core feature of bokeh.
Absolutely anything can skip down the priority list, absent time, money, or the right people with the necessary expertise. This is just one more example of the “Open Source Sustainability Crisis”. [1]
All I can recommend is to continue to check GH bug reports (make a new one with full details if you are not certain previous ones are duplicates).
I will spend a little time playing around with things to see if there is any immediate workaround I can find.
I’d happily work full time on Bokeh if I could support my family doing so. ↩︎
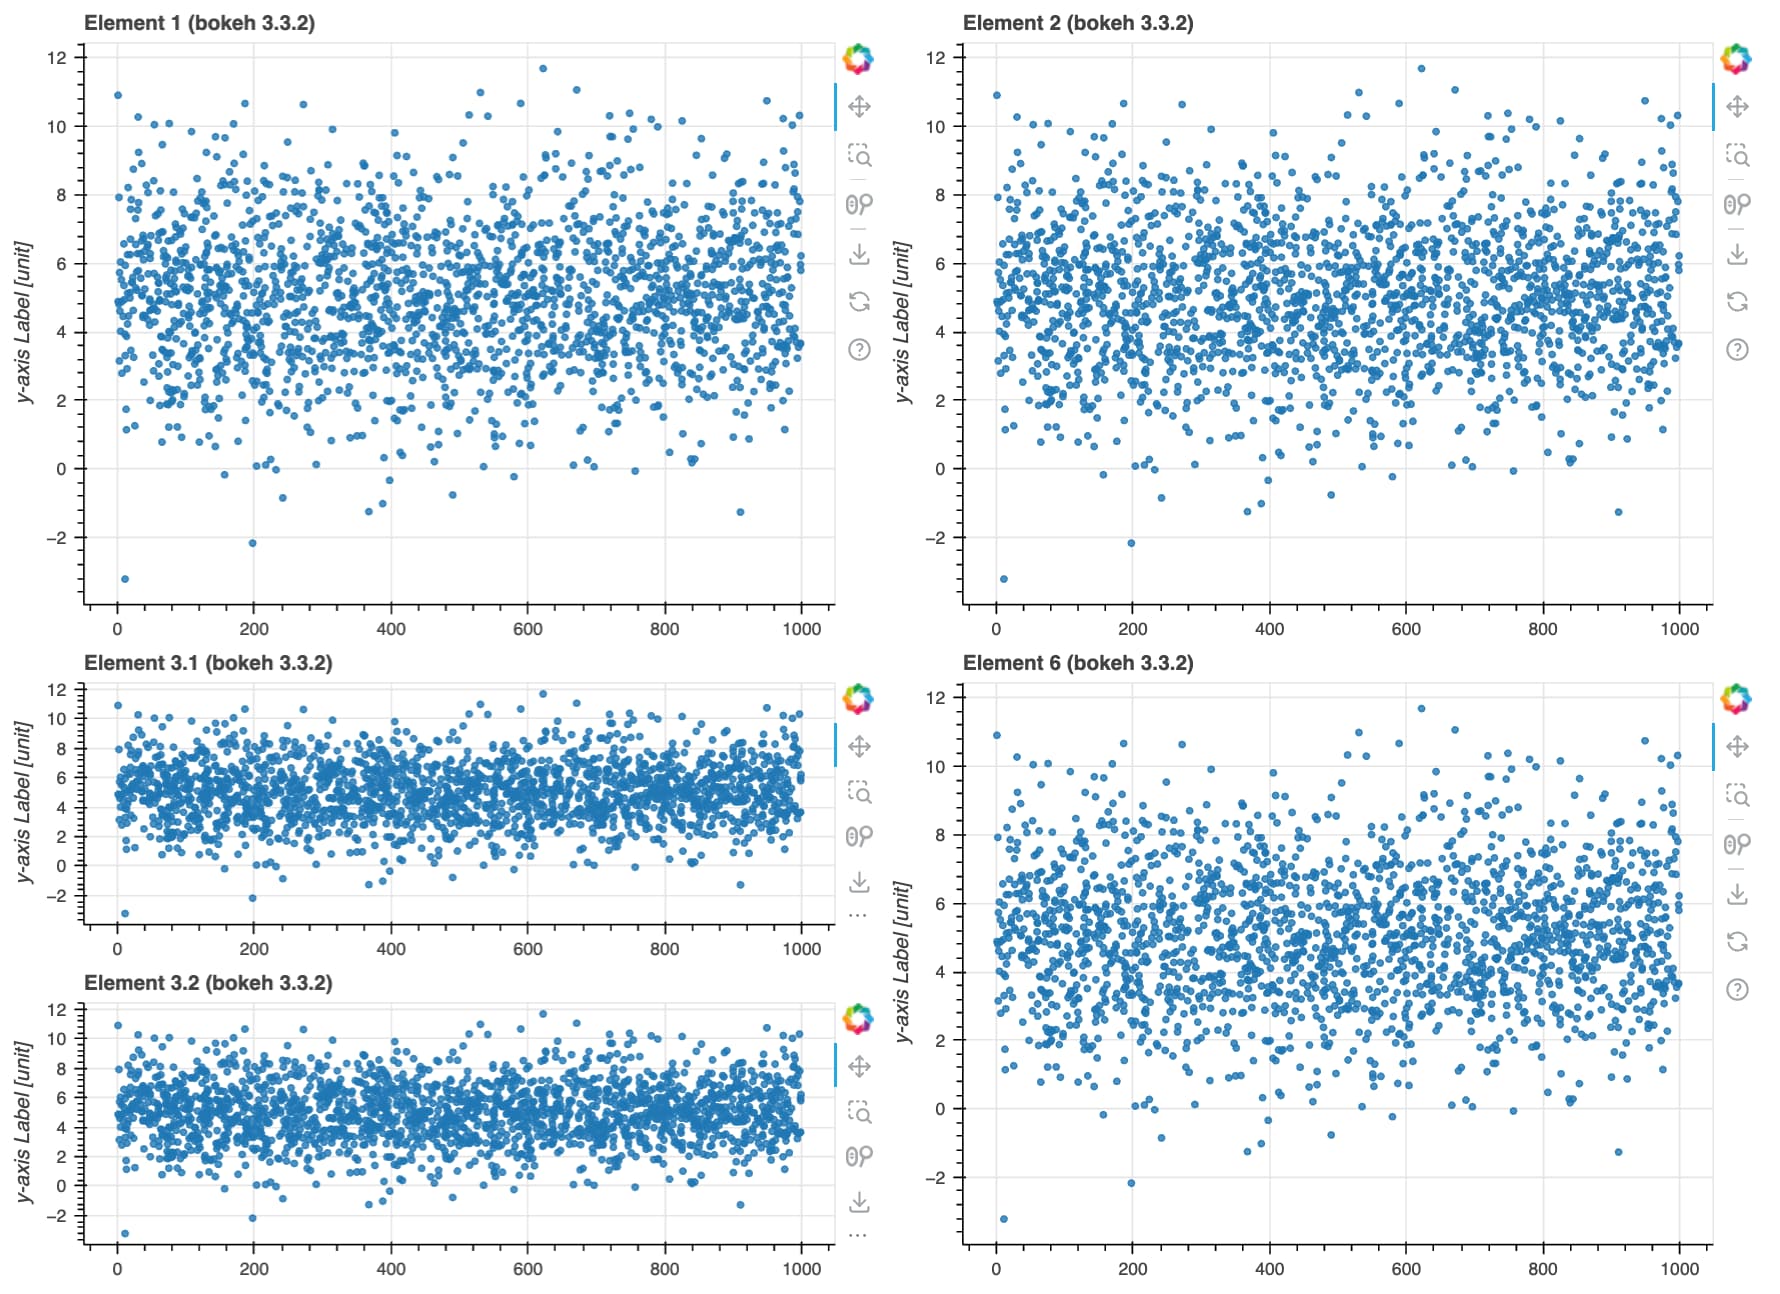
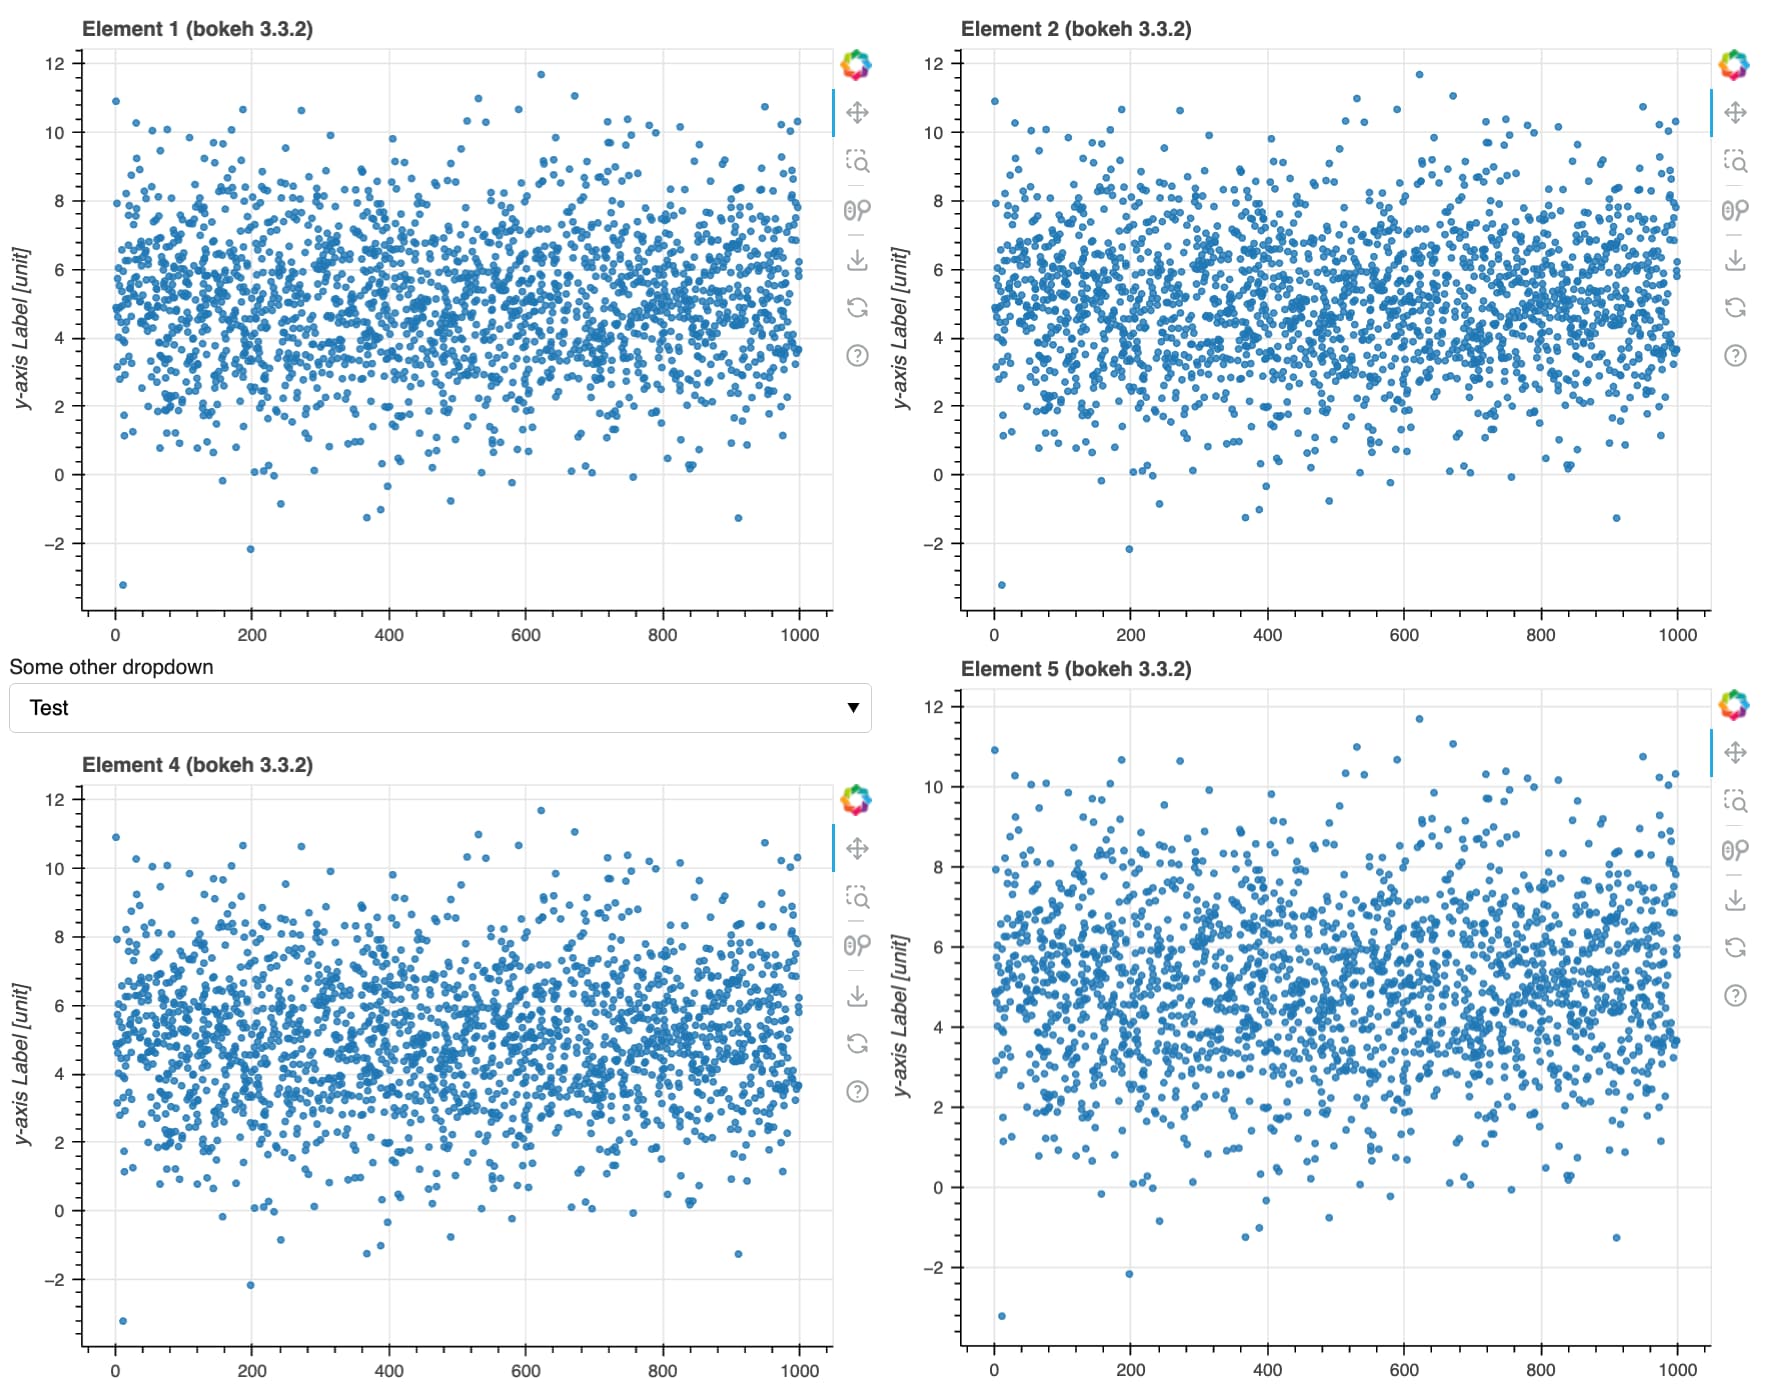
I’ve never been able to get the layout I wanted with grid_plot in Bokeh 3.* but I’m usually able to figure it out with using only row and column and different combinations of sizing_mode in many places. For your example, here is my work around (note that this is in Bokeh 3.3.2):
import numpy as np
import bokeh
from bokeh.layouts import gridplot, column, row
from bokeh.models import ColumnDataSource
from bokeh.models.widgets import Select
from bokeh.plotting import figure
from bokeh.io import curdoc, show

x = np.random.random(size=2000) * 1000
y = np.random.normal(size=2000) * 2 + 5
source = ColumnDataSource(dict(x=x, y=y))

def make_plot(title, sizing_mode='stretch_width'):
    p = figure(title=f"Element {title} (bokeh {bokeh.__version__})", sizing_mode=sizing_mode, height=400)
    p.scatter('x', 'y', alpha=0.8, source=source)
    p.yaxis.axis_label = 'y-axis Label [unit]'
    return p

p1 = make_plot("1")
p2 = make_plot("2")
p31 = make_plot("3.1", sizing_mode='stretch_both')
p32 = make_plot("3.2", sizing_mode='stretch_both')
p4 = make_plot("4")
p5 = make_plot("5", sizing_mode='stretch_both')
p6 = make_plot("6")

dropdown_graph = Select(
    title="Some other dropdown",
    value='Test', options=['Test'],
    sizing_mode='stretch_width',  # Works in bokeh 2.4
    )

grid1 = column(
    row(p1, p2, sizing_mode='stretch_width'),
    row(
        column(p31, p32, sizing_mode='stretch_both'),
        p6,
        sizing_mode='stretch_width'
    ),
    sizing_mode='stretch_width'
)

grid2 = column(
    row(p1, p2, sizing_mode='stretch_width'),
    row(
        column(dropdown_graph, p4, sizing_mode='stretch_both'),
        p5,
        sizing_mode='stretch_width'
    ),
    sizing_mode='stretch_width'
)

show(grid1)
show(grid2)
Thanks nmasnadi, that seems like an obvious workaround that I should have thought of myself. The only immediate downside seems to be the missing grouping of the toolbar, but that is not a deal breaker.
Bryan, I was hoping to avoid the blame game along the lines of “I demand that this powerful tool which I am using for free does exactly what I want!”. I am well aware of time and resource constraints.
The one good thing about the current AI-race is that it “sometimes” can lead to solutions, which were previously unobtainable. Now I am even more curious and I will try to ask GitHub Copilot to investigate the issue for me.