I’ve never been able to get the layout I wanted with grid_plot in Bokeh 3.* but I’m usually able to figure it out with using only row and column and different combinations of sizing_mode in many places. For your example, here is my work around (note that this is in Bokeh 3.3.2):
import numpy as np
import bokeh
from bokeh.layouts import gridplot, column, row
from bokeh.models import ColumnDataSource
from bokeh.models.widgets import Select
from bokeh.plotting import figure
from bokeh.io import curdoc, show

x = np.random.random(size=2000) * 1000
y = np.random.normal(size=2000) * 2 + 5
source = ColumnDataSource(dict(x=x, y=y))

def make_plot(title, sizing_mode='stretch_width'):
    p = figure(title=f"Element {title} (bokeh {bokeh.__version__})", sizing_mode=sizing_mode, height=400)
    p.scatter('x', 'y', alpha=0.8, source=source)
    p.yaxis.axis_label = 'y-axis Label [unit]'
    return p

p1 = make_plot("1")
p2 = make_plot("2")
p31 = make_plot("3.1", sizing_mode='stretch_both')
p32 = make_plot("3.2", sizing_mode='stretch_both')
p4 = make_plot("4")
p5 = make_plot("5", sizing_mode='stretch_both')
p6 = make_plot("6")

dropdown_graph = Select(
    title="Some other dropdown",
    value='Test', options=['Test'],
    sizing_mode='stretch_width',  # Works in bokeh 2.4
    )

grid1 = column(
    row(p1, p2, sizing_mode='stretch_width'),
    row(
        column(p31, p32, sizing_mode='stretch_both'),
        p6,
        sizing_mode='stretch_width'
    ),
    sizing_mode='stretch_width'
)

grid2 = column(
    row(p1, p2, sizing_mode='stretch_width'),
    row(
        column(dropdown_graph, p4, sizing_mode='stretch_both'),
        p5,
        sizing_mode='stretch_width'
    ),
    sizing_mode='stretch_width'
)

show(grid1)
show(grid2)
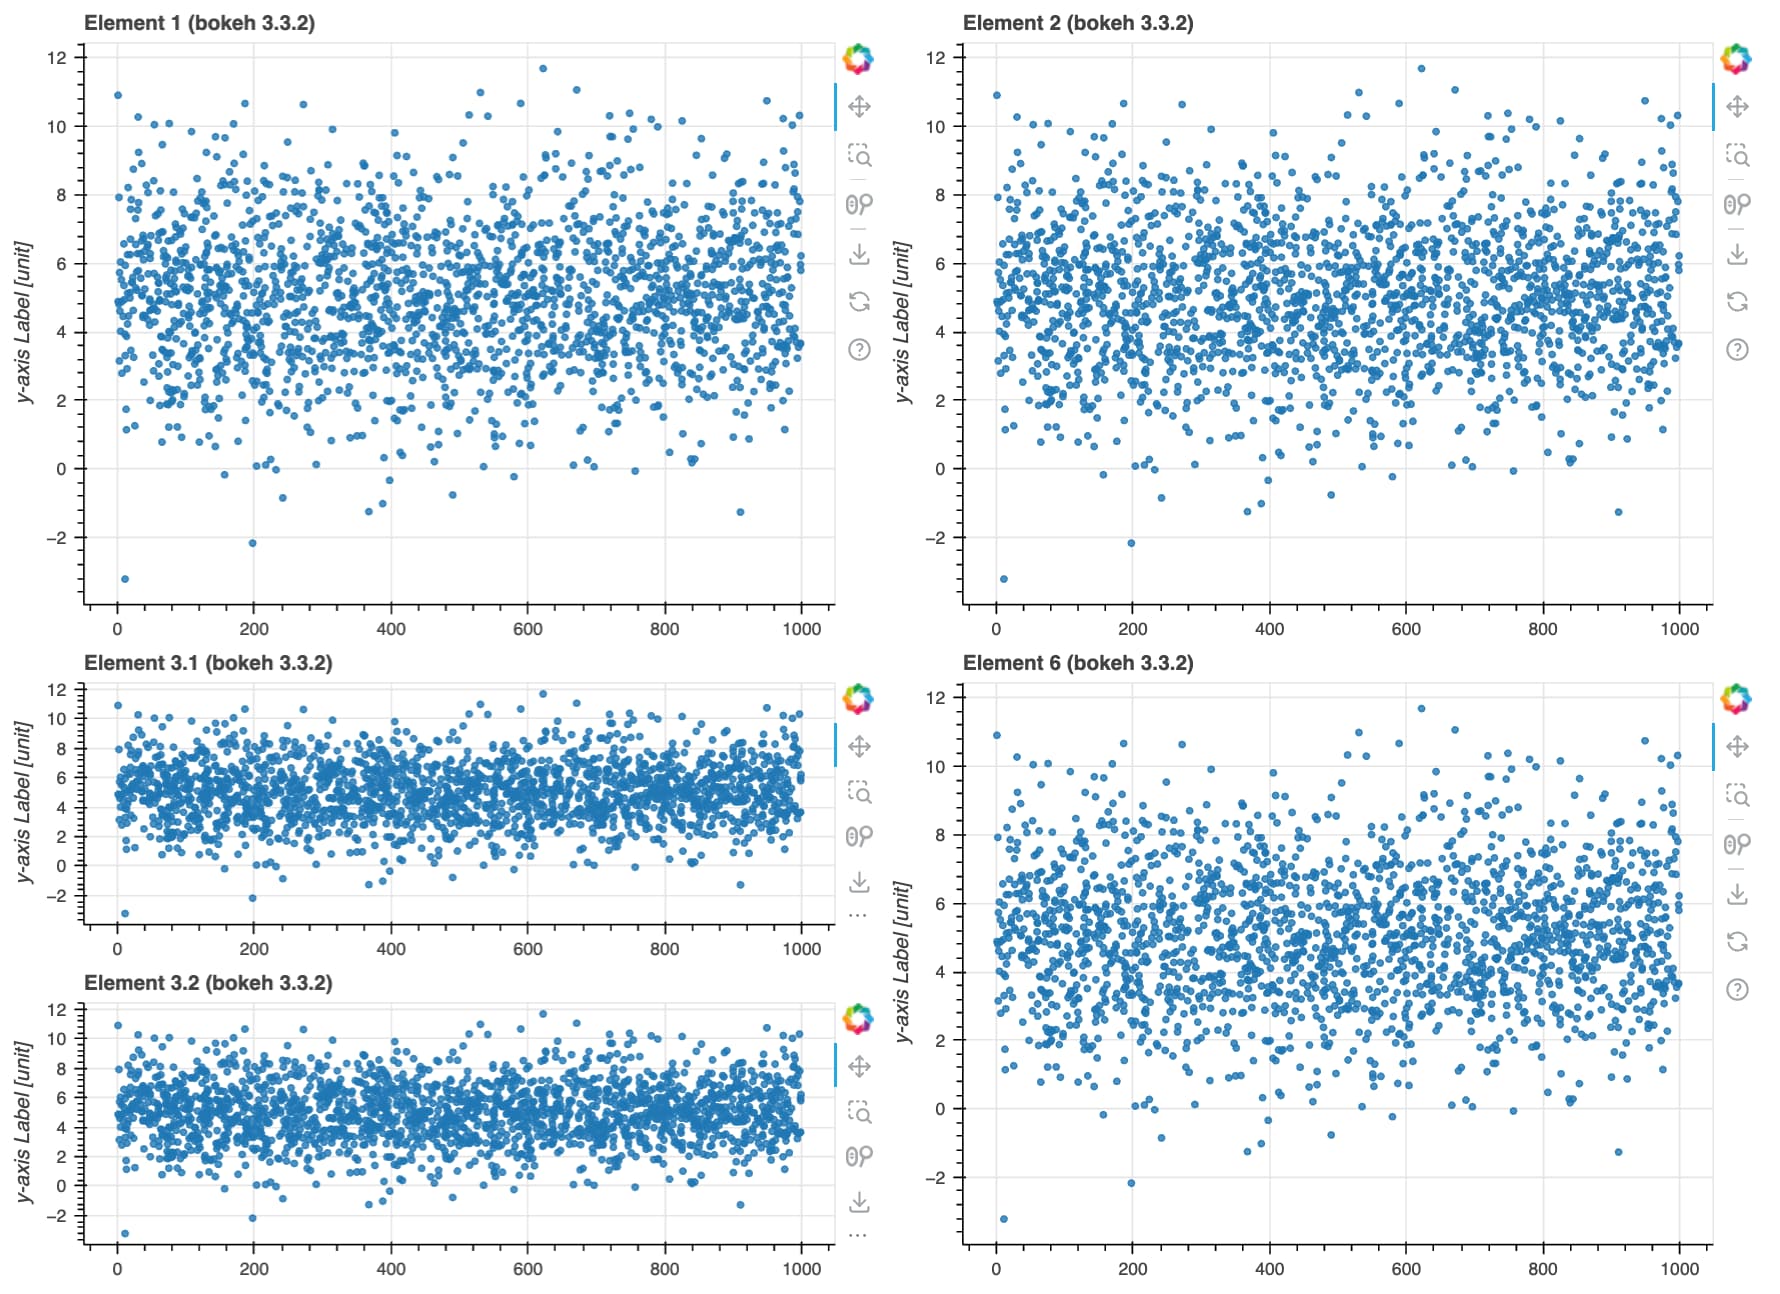
Here are the two grids in the example:
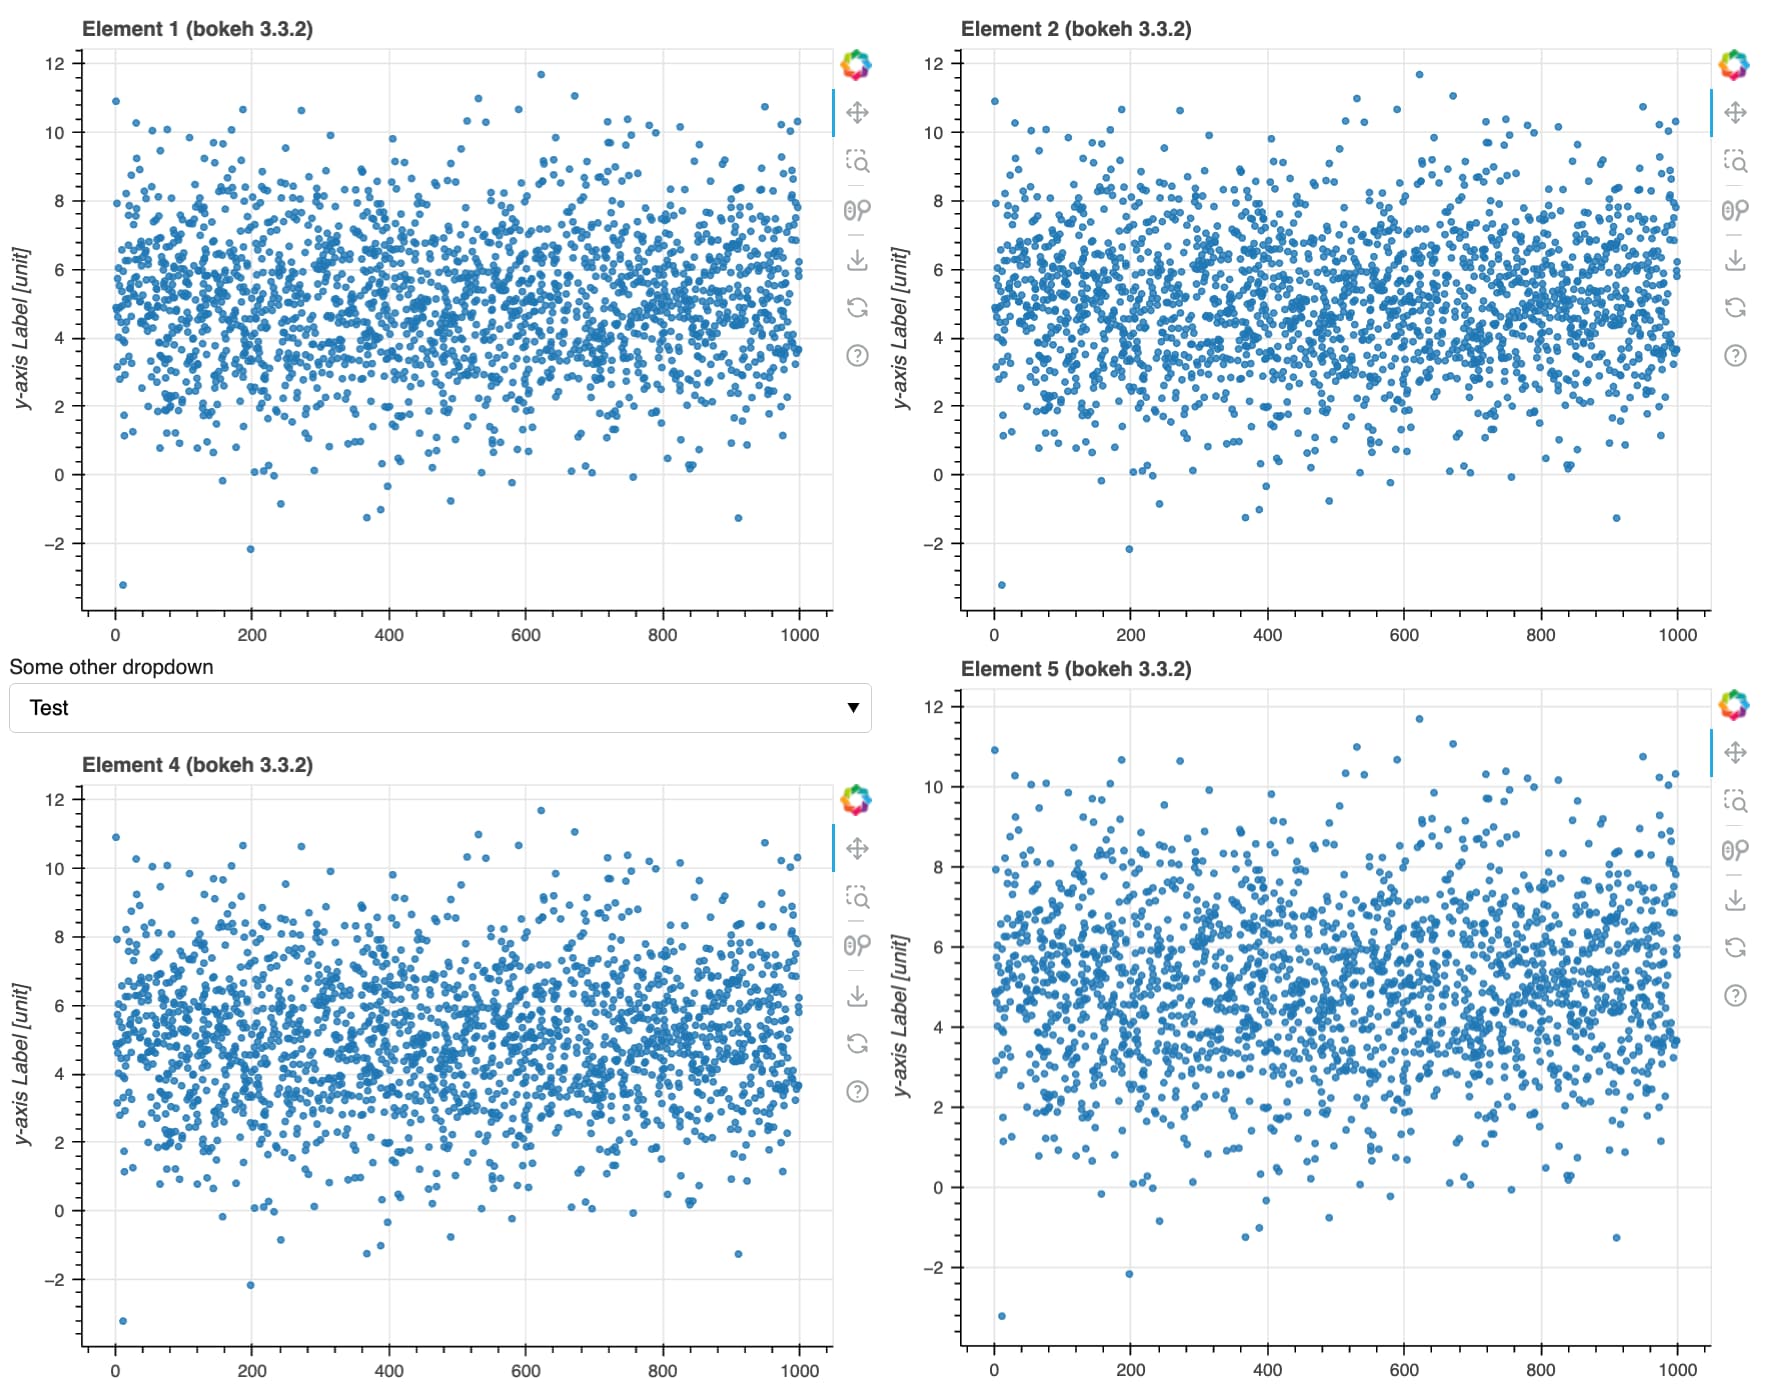
And with a dropdown:
Hope this helps!