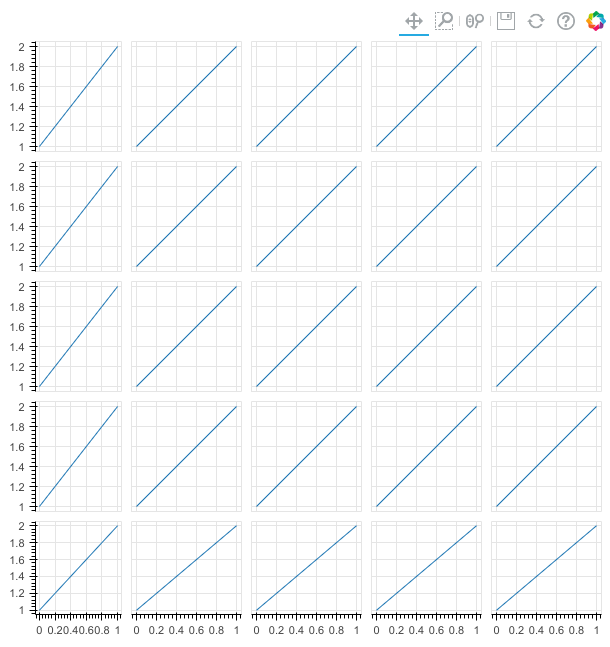
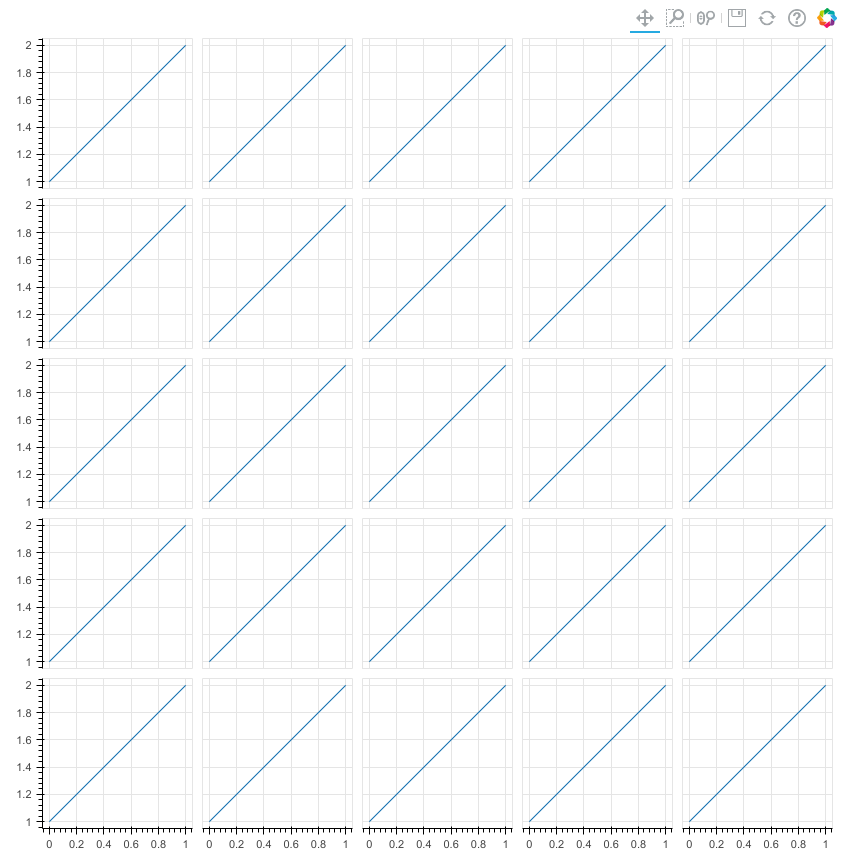
I’m trying to create a square grid of plots, where the x-axis is the same in each column and the y-axis is the same in each row, so that I can save space by making axes invisible, except in the first column and the last row. The grid should be responsive, and all plotting areas should have the same size. The goal is to create a pairplot.
Here is a simplified version of my attempt and the result:
ps = []
n = 5
for i in range(n):
    for j in range(n):
        p = figure()
        p.line([0, 1], [1, 2])
        p.xaxis.visible = (i == n - 1)
        p.yaxis.visible = (j == 0)
        ps.append(p)
gp = gridplot(ps, ncols=n, sizing_mode='scale_width')
show(gp)
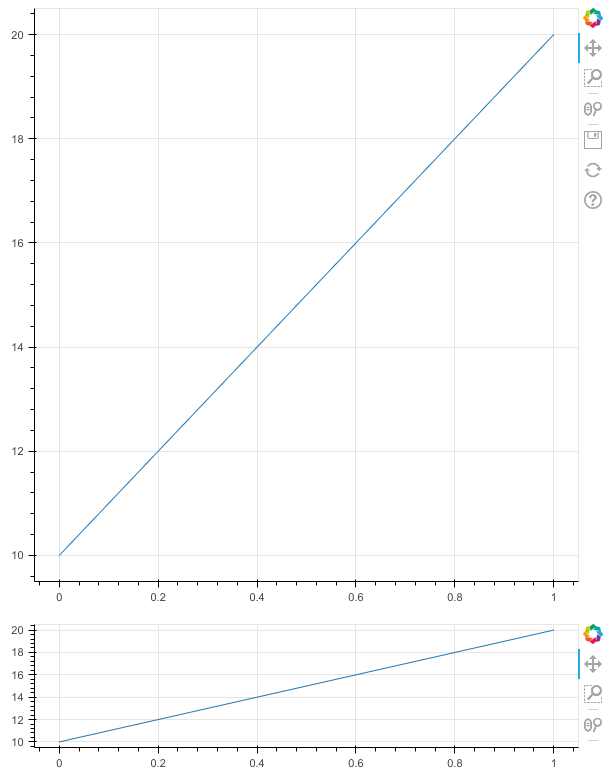
The problem is that the plots in the first column are less wide, and those in the last row are less high, probably to make space for the axes.
I tried to solve this by adding aspect_ratio=1 to figure, but that makes no difference. I’m guessing the aspect ratio applies to the full width and height of a plot, not the inner plotting area (or ‘frame’).
I also tried other sizing_modes, but none of them help.
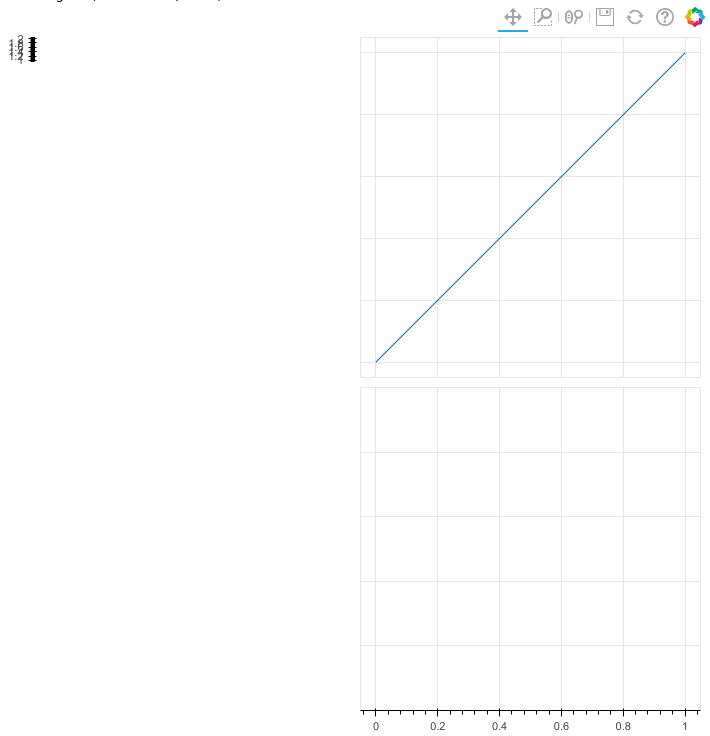
As a workaround, I tried to put extra “dummy” plots into the grid, in an additional first column and last row. The idea was that these plots have no glyphs and no area, and only serve to display the axis, ticks, tick labels and axis label.
Here is an illustration of this idea, for a 1×1 “grid”:
px.frame_height = 0 seems to have no effect at all, and py.frame_width = 0 successfully eliminates the area of the left plot, but also squeezes the axis into a corner.
This is close to what I want. However, the correct number seems to critically depend on the number of plots in the grid, and if it is too large the whole grid doesn’t display anymore. Moreover, the same trick applied to the left plot (py.aspect_ratio = 1/13) doesn’t make it narrower but extremely tall instead.
Your mental model about the sizing is correct; things like axes, axis labels, toolbars, etc. all “count” in the sizes of the figures and subtract from the plot area.
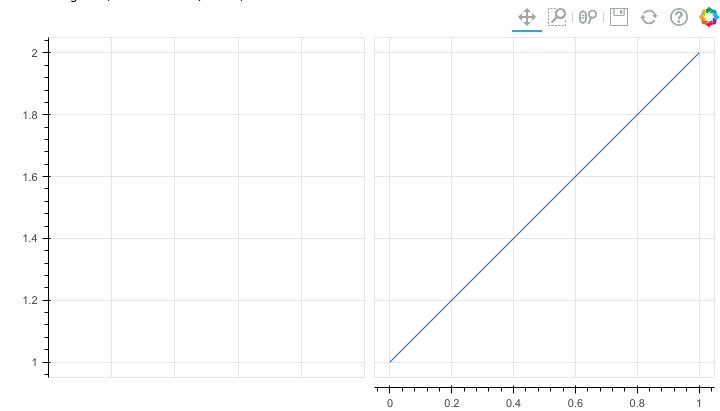
Here’s a hardcoded example based on your second post using a 1d “grid”. Toolbars are excluded and phantom glyphs are added to the axis-only boundary plots to achieve something close to the effect you’re after. Hopefully it gives some ideas how to adapt to your more general use case …
I’m guessing the aspect ratio applies to the full width and height of a plot, not the inner plotting area (or ‘frame’).
This is not accurate. What aspect_ratio does is modify the data range extents to match the screen aspect ratio of the inner frame. It does not do the converse, i.e. it does not modify the pixel dimensions of the plot or the inner frame (which I suppose is what you are expecting). Also, aspect_ratio only has effect when auto-ranging is active. If you have manually set range start/end, then Bokeh will not override your settings, regardless of the aspect_ratio value.
Typically an approach here is to use properties like min_border_left and min_border_bottom to define a fixed padding area for axes, which also needs to be added manually to the plot sizes for the plots that are on the edges with axes. There is a SPLOM example that does this in the repo:
Unfortunately it was written with the low-level bokeh.models API but it could be simplified considerably by using the more common bokeh.plotting. All that said, this example uses fixed plot sizes. I am not sure the technique will be as workable with responsive sizing modes.
Speaking plainly, this is still an area of improvement for Bokeh. Some ideas might include affording axes as standalone layout-able components, so that the canvas size and inner plot size can be the same in cases like this. This could maybe be accomplished to some degree “by hand” right now, but I would have to to try some experiments. Alternatively we could try to afford more direct control over the inner frame dimensions, but that is probably Bokeh 3.x territory for when we move away from such tightly managed layout control. If you’d like to discuss your use case in more detail, offer ideas, or engage with core devs directly about this, please feel free to open a GitHub discussion.
However, contrary to your statement, in my third post I was able to influence the pixel dimension ratio by setting px.aspect_ratio to different values.
After setting p.aspect_ratio = 4, the screen aspect ratio of the inner frame is not exactly 4 (but close, approx. 4.4); it looks more like the screen aspect ratio of the whole plot is 4. The data range extents have not been modified, roughly 1 / 10, which makes the data aspect ratio close to 40.
I’m afraid I still don’t understand what aspect_ratio does.
Thanks for the pointer to iris_splom example. I tried to make it work with responsive width, but wasn’t successful. My takeaway from both your and @_jm’s responses is that currently what I want to achieve is impossible in combination with responsiveness.
I mean, I can achieve equal-sized frames by setting frame_width and frame_height explicitly on each plot – it’s just not responsive:
ps = []
n = 5
for i in range(n):
    for j in range(n):
        p = figure()
        p.line([0, 1], [1, 2])
        p.xaxis.visible = (i == n - 1)
        p.yaxis.visible = (j == 0)
        p.frame_height = 150
        p.frame_width = 150
        ps.append(p)
gp = gridplot(ps, ncols=n)
show(gp)
Alternatively we could try to afford more direct control over the inner frame dimensions
I would have some ideas for that. A while ago, when I still used Matlab, I didn’t think its plots are production-ready, so I implemented a “toolbox” that creates TikZ/PGF plots via LaTeX. Part of that was a layout facility:
The idea is that the user defines (outer) boxes over a grid, and can choose to specify the screen aspect ratio of each plot area (inner box) or not. That leads to a set of linear relationships and constraints, which can be solved by some linear algebra. It was designed for a fixed total width of a figure, but should also work in a responsive setting. I was pretty happy with this, and I’ll probably reimplement it at some point for this project.
If this would be welcome, I’d be happy to start a discussion.
I should offer a brief retrospective and prospective: Layout has been a consistent challenge for Bokeh for many years. TLDR we simply tried to do too much, and to many things that were duplicative of built-in browser capability. Specifically, in fact, we used to employ a constraint solver to attempt to coordinate layout across both DOM entities and things “inside” a plot canvas all at once. This proved unpredictable, hard to develop and debug, awkwardly contrary to the browser, and oftentimes, slow. So eventually that was ditched. We still manage DOM layout, just much more simply. But in “3.0” we do plan to completely stop attempting to manage non-canvas layout. I mention all this merely to make sure the right context is set for a discussion. We will always have to manage all the layout inside a canvas, but fairly soon(-ish) that will be all we will manage (so discussion should keep that in mind and focus there).
No longer trying to manage DOM layout seems like a good idea to me. But this implies that if the relative positions of several plots are managed, that would mean to have several plots within one canvas element?
Affording an option to put entire grid plots on a single canvas is a related, but separate, issue. There is ongoing work to work towards that as well (e.g. subplots / subcoordinates as a first step)