Group ordering in a multi-level vbar plot

hi,

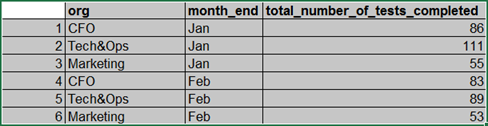
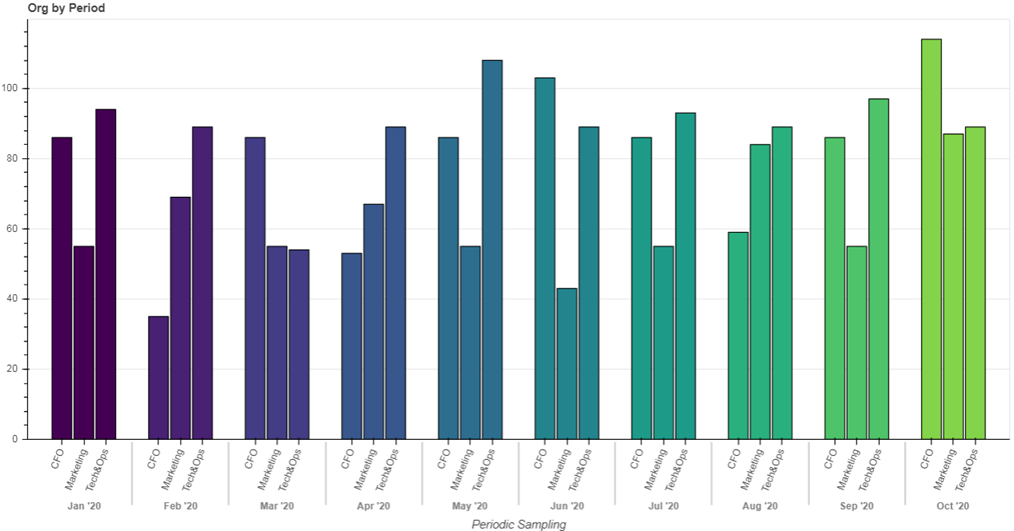
I have a vbar plot that I’m trying to layout by 2 different groups on the xaxis. I’m using a pandas dataframe to read an Excel file with the data.
My outer group is ‘month_end’ and is the names of different months. when I display the plot, the outer group is ordered alphabetically so that “Feb” shows before “Jan”.
My question is, can I use a pandas dataframe and a ColumnDataSource and still order the outer group by the order in which the months are chronologically sequenced? Jan, Feb, March, etc.

df = pd.read_excel('org_compliance_timeseries.xlsx', index_col=0)
df.org = df.org.astype(str)
df.month_end = df.month_end.astype(str)
dfgroup = df.groupby(by=['month_end', 'org'])
source = ColumnDataSource(dfgroup)

# periods = ['Jan', 'Feb']
index_cmap = factor_cmap('month_end_org', palette=OrRd3, factors=sorted(df.month_end.unique()), end=1)

p = figure(title="org by month",
       x_range=dfgroup, toolbar_location=None, tooltips=[("Tests Completed", "@total_number_of_tests_completed_mean"), ("month_end, org", "@month_end_org")], plot_width=600)
p.vbar(x='month_end_org', top='total_number_of_tests_completed_mean', width=0.9, source=df2group, line_color="black", fill_color=index_cmap)

data

Yes, just change x_range=dfgroup to an explicit list of months.
This is the code in Bokeh that does the sorting:

[...]
if pd and isinstance(range_input, pd.core.groupby.GroupBy):
    return FactorRange(factors=sorted(list(range_input.groups.keys())))
[...]

When using figure, you don’t have to call FactorRange yourself, just pass a list like x_range=['Jan', 'Feb', ...].

thanks, I modified my code to:

    index_cmap = factor_cmap('month_end_cio', palette=GnBu3, factors=df2.month_end.unique(), end=1)

p = figure(title="Org by Period",
       x_range=['Jan', 'Feb'], toolbar_location=None, tooltips=[("Tests Completed", "@total_number_of_tests_completed_mean"), ("month_end, org", "@month_end_org")], plot_width=600)
p.vbar(x='month_end_org', top='total_number_of_tests_completed_mean', width=0.9, source=dfgroup, line_color="black", fill_color=index_cmap)

but the plot does not appear to display anymore, and there is no error message (which were displayed before the change) other than:

WARNING:bokeh.core.validation.check:W-1005 (FIXED_SIZING_MODE): 'fixed' sizing mode requires width and height to be set: Column(id='1545', ...)
WARNING:bokeh.core.validation.check:W-1005 (FIXED_SIZING_MODE): 'fixed' sizing mode requires width and height to be set: Row(id='1541', ...)
WARNING:bokeh.core.validation.check:W-1005 (FIXED_SIZING_MODE): 'fixed' sizing mode requires width and height to be set: Row(id='1542', ...)
WARNING:bokeh.core.validation.check:W-1005 (FIXED_SIZING_MODE): 'fixed' sizing mode requires width and height to be set: Row(id='1543', ...)
WARNING:bokeh.core.validation.check:W-1005 (FIXED_SIZING_MODE): 'fixed' sizing mode requires width and height to be set: Row(id='1544', ...)

if I go back to using
p = figure(title=“org by month”,
x_range=dfgroup, toolbar_location=None, tooltips=[(“Tests Completed”, “@total_number_of_tests_completed_mean”), (“month_end, org”, “@month_end_org”)], plot_width=600)
the plot does display, but with alphabetically sorted months.

Ah, right - you have two-level factors. Just specify tuples then instead of months’ names, like x_range=[('Jan', 'CFO'), ('Jan', 'Marketing'), ...].
You can follow the example here: Handling categorical data — Bokeh 2.4.2 Documentation

thanks! was able to recreate following the example above.

2 Likes