Hello,
I have the following data available to me in pandas dataframe.
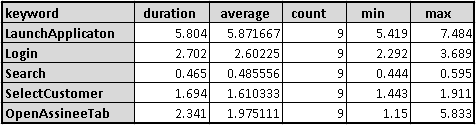
I would like the horizontal axis to have the keywords data and the vertical axis be numeric.
Along the horizontal axis I would like to have multiple bars for each keyword, showing duraton, average, min and max.
I have been able to do this in another library as seen here
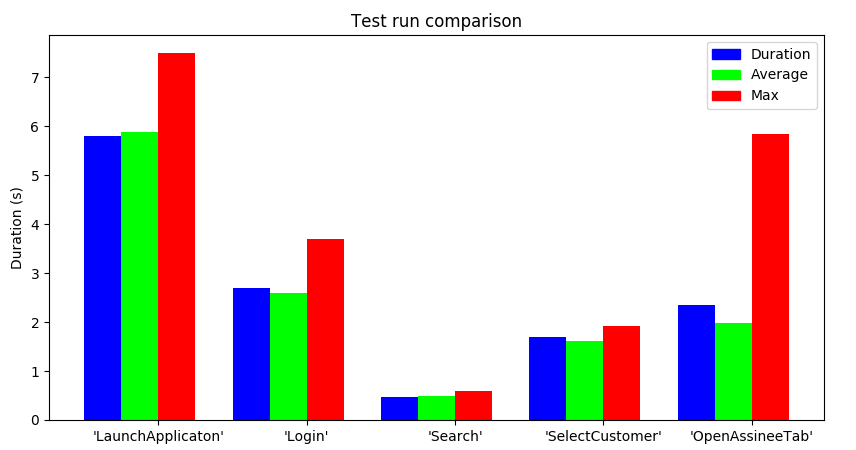
I just can’t seem to figure out how to achieve in Bokeh using either the Histogram or Bar, (without automatic aggregation), has anyone had any experience with this in Bokeh?
Any input is appreciated
Thanks
Sean