On Sep 17, 2017, at 14:17, Hiram Foster [email protected] wrote:
Thanks Brian for all your help. Here is the full code (I’m using Jupyter 4.3.0).Btw, conda install bokeh is still giving me 0.12.7 as the most recent version.
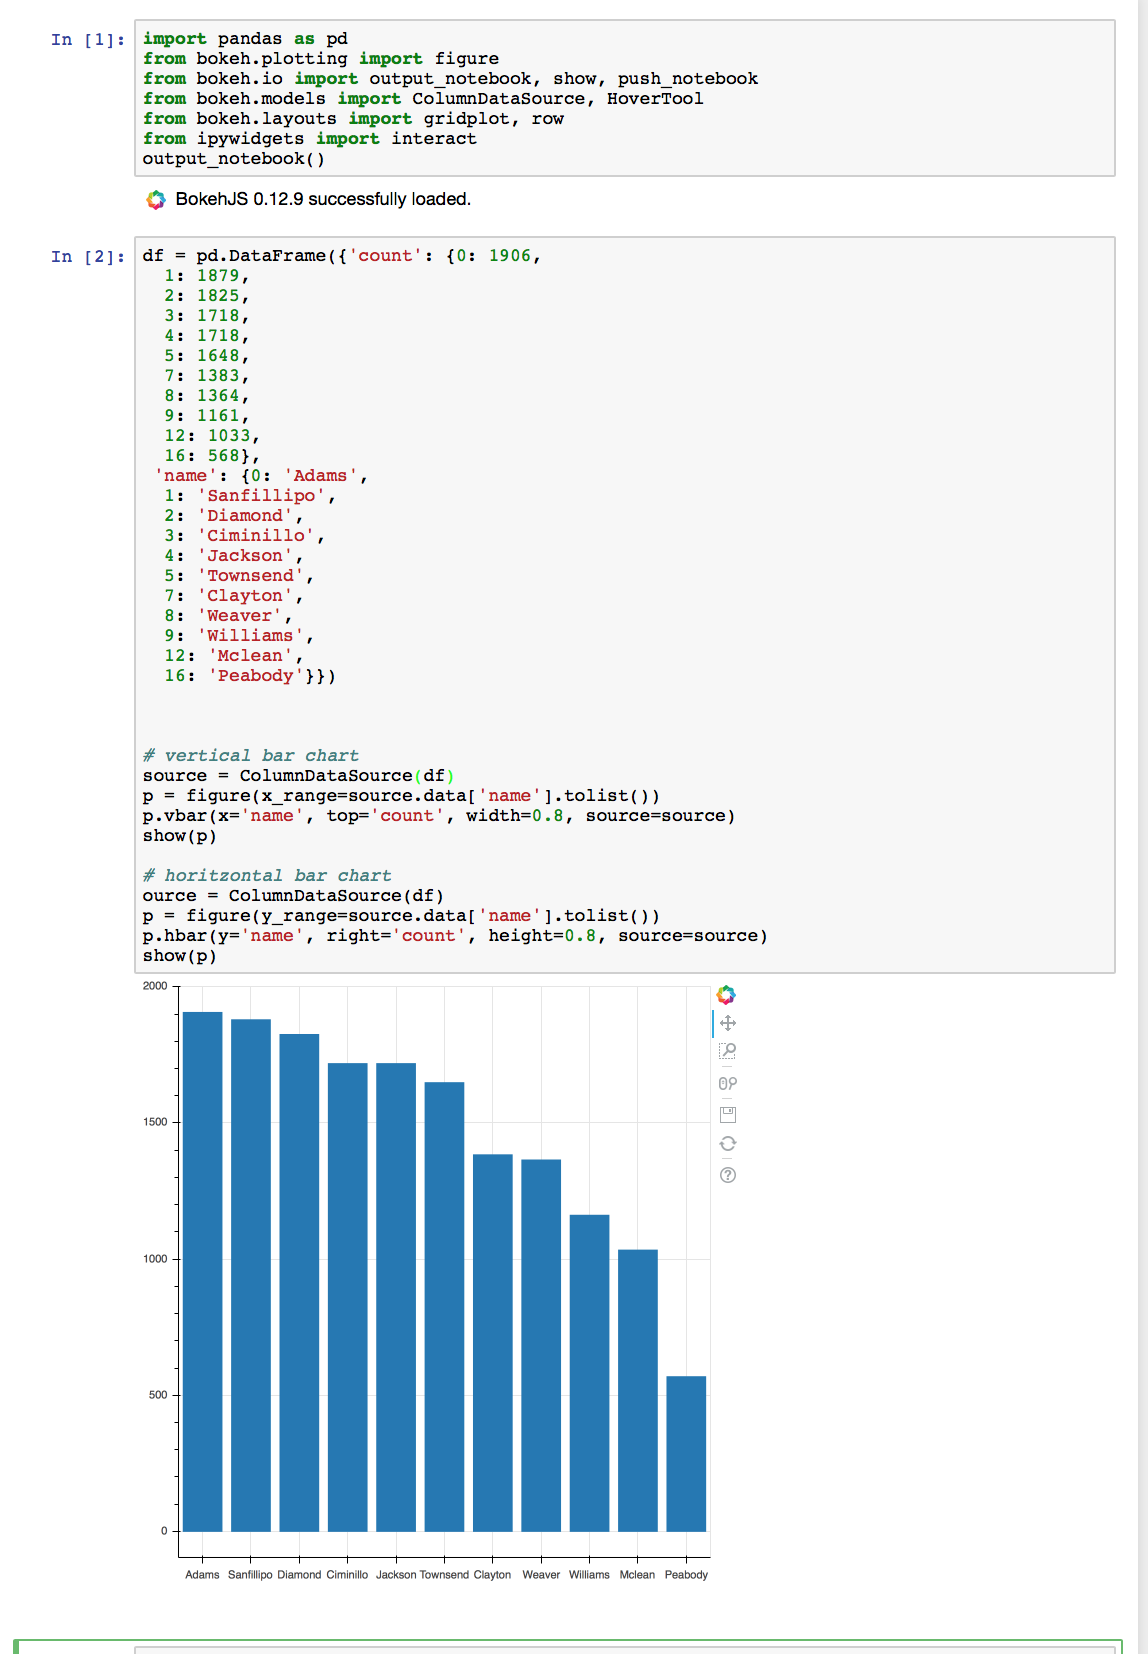
import pandas as pd
from bokeh.plotting import figure
from bokeh.io import output_notebook, show, push_notebook
from bokeh.models import ColumnDataSource, HoverTool
from bokeh.layouts import gridplot, row
from ipywidgets import interact
output_notebook()
df = pd.DataFrame({‘count’: {0: 1906,
1: 1879,
2: 1825,
3: 1718,
4: 1718,
5: 1648,
7: 1383,
8: 1364,
9: 1161,
12: 1033,
16: 568},
‘name’: {0: ‘Adams’,
1: ‘Sanfillipo’,
2: ‘Diamond’,
3: ‘Ciminillo’,
4: ‘Jackson’,
5: ‘Townsend’,
7: ‘Clayton’,
8: ‘Weaver’,
9: ‘Williams’,
12: ‘Mclean’,
16: ‘Peabody’}})
vertical bar chart
source = ColumnDataSource(df)
p = figure(x_range=source.data[‘name’].tolist())
p.vbar(x=‘name’, top=‘count’, width=0.8, source=source)
show(p)
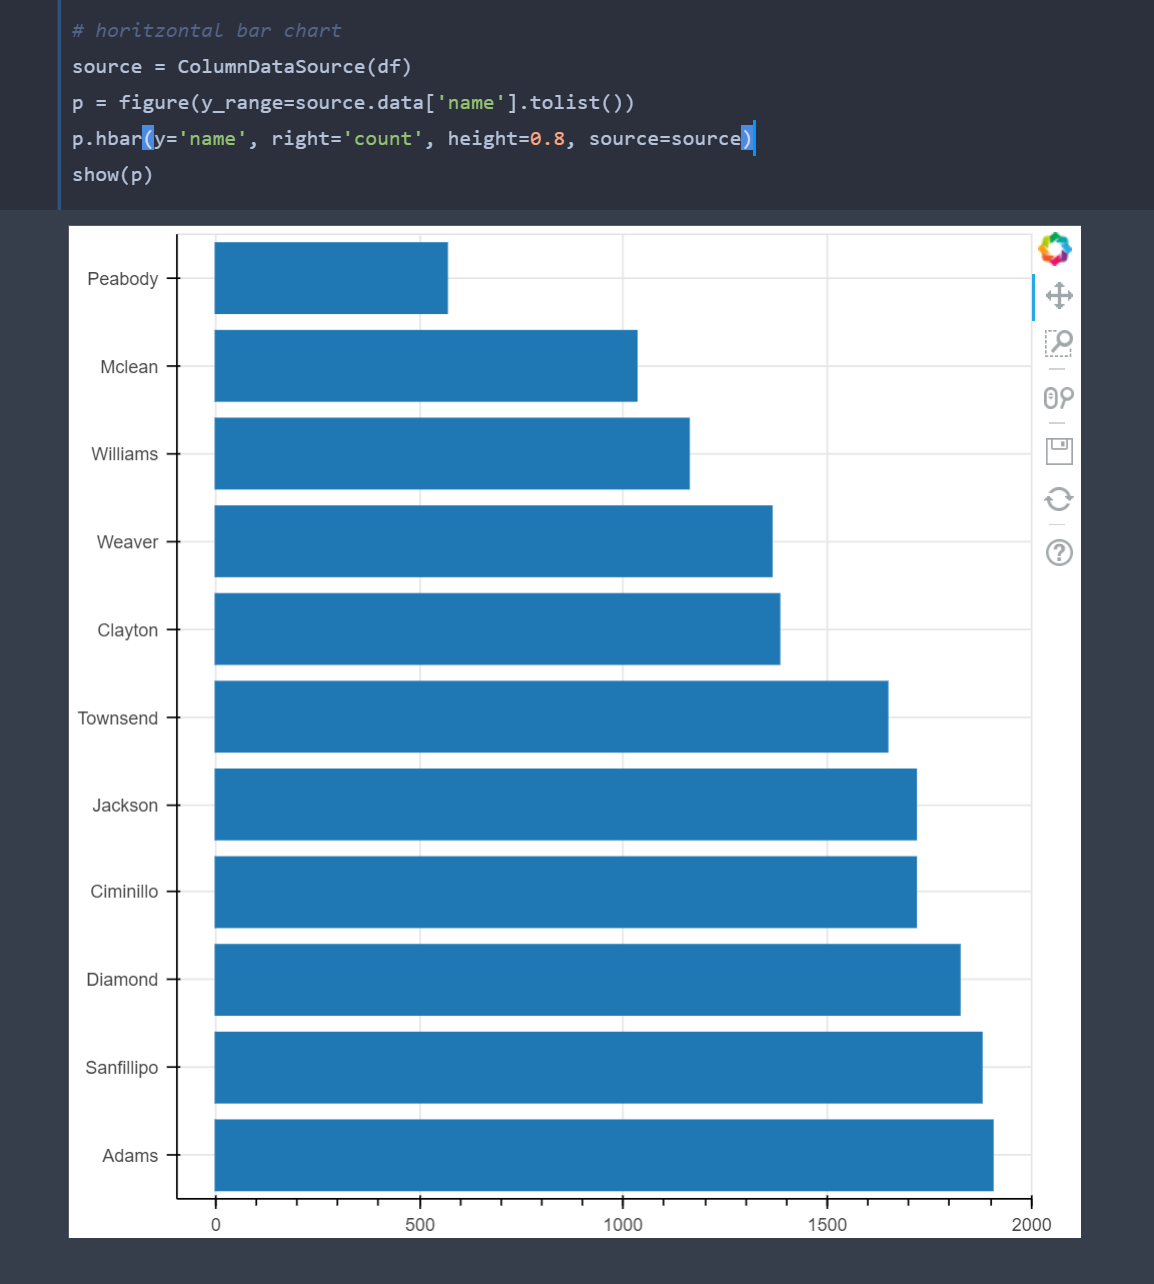
horitzontal bar chart
ource = ColumnDataSource(df)
p = figure(y_range=source.data[‘name’].tolist())
p.hbar(y=‘name’, right=‘count’, height=0.8, source=source)
show(p)
On Sunday, September 17, 2017 at 10:26:11 AM UTC-4, Bryan Van de ven wrote:
Hi,
That code is not complete (it’s missing imports and a call to output_file) and when I add the missing code, it still does not run, because the column values of transfer_rat are not columns, they are dictionaries. I’ll be happy to investigate further if you post a 100% complete, runnable as-is code sample. Otherwise my best suggestion offhand is to try using the latest version 0.12.9 instead.
Thanks,
Bryan
On Sep 17, 2017, at 09:15, Hiram Foster <hi…@boldpenguin.com> wrote:
Version: 0.12.7
transfer_rat = {‘count’: {0: 1906,
1: 1879,
2: 1825,
3: 1718,
4: 1718,
5: 1648,
7: 1383,
8: 1364,
9: 1161,
12: 1033,
16: 568},
‘name’: {0: ‘Adams’,
1: ‘Sanfillipo’,
2: ‘Diamond’,
3: ‘Ciminillo’,
4: ‘Jackson’,
5: ‘Townsend’,
7: ‘Clayton’,
8: ‘Weaver’,
9: ‘Williams’,
12: ‘Mclean’,
16: ‘Peabody’}}
source = ColumnDataSource(transfer_rat)
p = figure(y_range=source.data[‘name’].tolist(), width=500, height=400)
p.hbar(y=‘name’, right=‘count’, height=0.8, source=source)
show(p)
However, the same data works for vbar (when changing y_range, y, right, and height to x_range, x, top, and width, respectively).
On Sunday, September 17, 2017 at 2:49:49 AM UTC-4, Bryan Van de ven wrote:
Hi,
When reporting a problem, it’s always advised to state what version you are using, as well as provide a complete test case that can be run to reproduce the issue. There are several examples in the User’s Guide that use hbar with a CDS. So this could be a problem with an older version, but it’s not known what version you are using. Or possibly a problem specific to your code or data, but it can’t be run to investigate because it’s not complete.
Thanks,
Bryan
On Sep 16, 2017, at 22:45, hi…@boldpenguin.com wrote:
Using a pandas DataFrame to make a horizontal bar chart. The vbar code works like it should, but when I change it to hbar, it breaks and I have to do some workarounds.
This works:
source = ColumnDataSource(dataframe)
p = figure(x_range=source.data[‘operator_name’].tolist(), width=500, height=400)
p.vbar(x=‘operator_name’, top=‘count’, width=0.8, source=source)
show(p)
This doesn’t:
source = ColumnDataSource(dataframe)
p = figure(y_range=source.data[‘operator_name’].tolist(), width=500, height=400)
p.hbar(y=‘operator_name’, right=‘count’, height=0.8, source=source)
show(p)
–
You received this message because you are subscribed to the Google Groups “Bokeh Discussion - Public” group.
To unsubscribe from this group and stop receiving emails from it, send an email to bokeh+un…@continuum.io.
To post to this group, send email to bo…@continuum.io.
To view this discussion on the web visit https://groups.google.com/a/continuum.io/d/msgid/bokeh/7651af16-84b5-4358-b259-cbfa1841479c%40continuum.io.
For more options, visit https://groups.google.com/a/continuum.io/d/optout.
–
You received this message because you are subscribed to the Google Groups “Bokeh Discussion - Public” group.
To unsubscribe from this group and stop receiving emails from it, send an email to [email protected].
To post to this group, send email to [email protected].
To view this discussion on the web visit https://groups.google.com/a/continuum.io/d/msgid/bokeh/33b726f5-07cc-4135-9fdb-1594d8825a59%40continuum.io.
For more options, visit https://groups.google.com/a/continuum.io/d/optout.
–
You received this message because you are subscribed to the Google Groups “Bokeh Discussion - Public” group.
To unsubscribe from this group and stop receiving emails from it, send an email to [email protected].
To post to this group, send email to [email protected].
To view this discussion on the web visit https://groups.google.com/a/continuum.io/d/msgid/bokeh/2024aa28-9480-47d4-8f9b-5569cc73c4cb%40continuum.io.
For more options, visit https://groups.google.com/a/continuum.io/d/optout.