On Jan 30, 2018, at 16:32, [email protected] wrote:
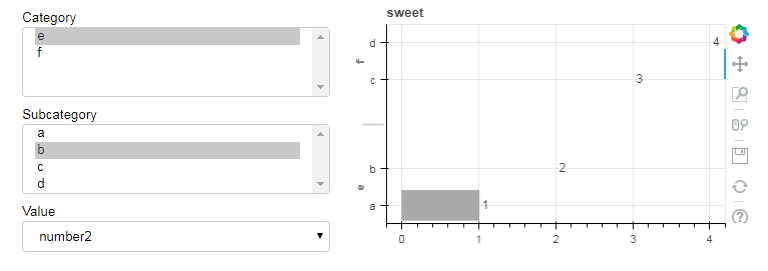
...and by labels not updating, I mean these:
<Auto Generated Inline Image 1.png>
On Tuesday, January 30, 2018 at 4:23:41 PM UTC-6, tickn...@gmail.com wrote:
Okay I'm getting closer. I got the bars to update but the labels are not updating.
I changed the default value of nums to "number". This makes it match the initial data source, which appears to have fixed the bars. So the bars are now behaving as I would expect, but the labels for each column are not updating when changing the value of nums to 'number2'. I'm still getting the same error in the browser.
On Tuesday, January 30, 2018 at 3:53:39 PM UTC-6, tickn...@gmail.com wrote:
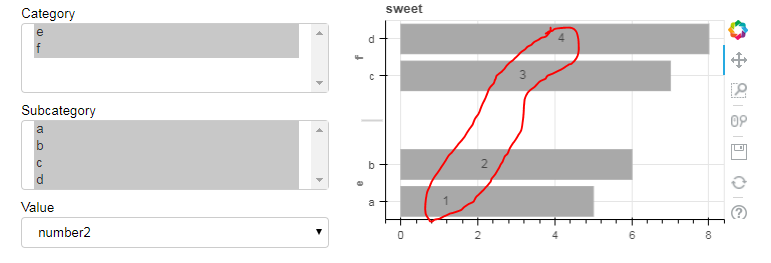
Great! Thanks, Bryan. I made the changes you suggested, which appears to have gotten me a little closer, but now I'm still seeing odd behavior.
Not being a web developer, I now realize after reading your response that I can see Bokeh errors in the browser. After running my newly updated module, and changing the category or subcategory, the error I get in the browser is this:
properties.js:67 Uncaught Error: attempted to retrieve property array for nonexistent field 'number'
I'm not seeing where my code would be causing this error.
From the code in my original message, I changed...
df4 = df3.reindex(columns=['category', 'subcategory', nums.value])
to...
df4 = df3.reindex(columns=['category', 'subcategory', 'cat_sub', nums.value, ])
Then I removed r.children[1] = update_glyph().
I also changed the subcat value to 'c'.
I've been wrestling with this for way too long, so I appreciate your help!
On Tuesday, January 30, 2018 at 12:42:11 PM UTC-6, Bryan Van de ven wrote:
Hi,
There's at least a few immediate things wrong. This line:
df4 = df3.reindex(columns=['category', 'subcategory', nums.value])
removes the "cat_sub" column, but that column is needed by the glyph and the label. You can see browser JS console error messages complaining about the missing field. Adding this afterward seems to fix that:
df4['cat_sub'] = list(zip(df4.category, df4.subcategory))
But also this line is wrong:
r.children[1] = update_glyph()
The update_glyph function returns None, so you are actually replacing your plot with None. I just deleted that line altogether.
After that, I would describe things as working. Although with the given data, and initial configuration, things are a bit clumsy. Since no subcategories are initially selected, the first time update is called, everything looks empty. But if you select some/all subcategories you can see the updates.
Thanks,
Bryan
> On Jan 30, 2018, at 11:58, tickn...@gmail.com wrote:
>
> Could someone tell me why this doesn't work and what I need to do to fix it?
>
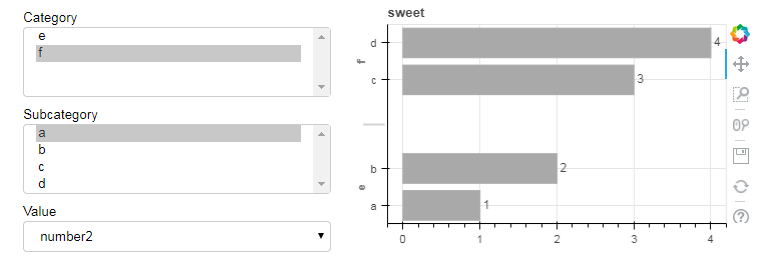
> I'm wanting a horizontal bar graph to update based on a few widget selections in Bokeh Server, but it is not updating as expected.
>
> <Auto Generated Inline Image 1.png>
>
> Plus, the initial chart is not filtering correctly.
>
> <Auto Generated Inline Image 2.png>
>
> I'm not getting any errors. The code is below.
>
> import pandas as pd
>
> from bokeh.layouts import row, widgetbox
> from bokeh.models.widgets import Select, MultiSelect
> from bokeh.plotting import curdoc, figure
> from bokeh.models import ColumnDataSource, LabelSet
> from bokeh.models.ranges import FactorRange
> from bokeh.io import show
>
> df = pd.DataFrame(data={
> 'category': ['e', 'e', 'f', 'f'],
> 'subcategory': ['a', 'b', 'c', 'd'],
> 'number': [1, 2, 3, 4],
> 'number2': [5, 6, 7, 8]
> })
>
> df['cat_sub'] = list(zip(df.category, df.subcategory))
>
> source = ColumnDataSource(df)
>
> p = figure(plot_width=800,
> y_range=FactorRange(factors=list(df.cat_sub)),
> title='sweet', plot_height=500)
>
> h1 = p.hbar(right="number", y="cat_sub", color='darkgrey',
> height=0.8, source=source)
>
> labels = LabelSet(
> text='number', text_font_size='9pt', level='glyph',
> x='number', y='cat_sub', x_offset=3, y_offset=-6.5,
> source=source)
>
> p.add_layout(labels)
>
>
> def update_source():
> df2 = df.copy()
> df3 = df2[
> df2.category.isin(cats.value)
> & df2.subcategory.isin(subcats.value)]
> df4 = df3.reindex(columns=['category', 'subcategory', nums.value])
> source.data = source.from_df(df4)
>
>
> def update_glyph():
> h1.glyph.right = nums.value
> labels.text = nums.value
> labels.x = nums.value
>
>
> def update(attr, old, new):
> update_source()
> update_glyph()
> r.children[1] = update_glyph()
>
>
> catlist_u = df['category'].unique().tolist()
> subcatlist_u = df['subcategory'].unique().tolist()
>
> cats = MultiSelect(title='Category', value=['f'], options=catlist_u)
>
> subcats = MultiSelect(title='Subcategory', value=['a'],
> options=subcatlist_u)
>
> nums = Select(title='Value', value='number2', options=['number', 'number2'])
>
> cats.on_change('value', update)
> subcats.on_change('value', update)
> nums.on_change('value', update)
>
> w = widgetbox([cats, subcats, nums])
>
> r = row([w, p], sizing_mode="scale_width")
>
> curdoc().add_root(r)
> curdoc().title = "test"
>
> Thanks in advance!
>
> --
> You received this message because you are subscribed to the Google Groups "Bokeh Discussion - Public" group.
> To unsubscribe from this group and stop receiving emails from it, send an email to bokeh+un...@continuum.io.
> To post to this group, send email to bo...@continuum.io.
> To view this discussion on the web visit https://groups.google.com/a/continuum.io/d/msgid/bokeh/31592327-45e1-4312-8731-fceb27f82937%40continuum.io\.
> For more options, visit https://groups.google.com/a/continuum.io/d/optout\.
> <Auto Generated Inline Image 1.png><Auto Generated Inline Image 2.png>
--
You received this message because you are subscribed to the Google Groups "Bokeh Discussion - Public" group.
To unsubscribe from this group and stop receiving emails from it, send an email to [email protected].
To post to this group, send email to [email protected].
To view this discussion on the web visit https://groups.google.com/a/continuum.io/d/msgid/bokeh/ecee823d-392e-432b-b5b6-21814f4caf88%40continuum.io\.
For more options, visit https://groups.google.com/a/continuum.io/d/optout\.
<Auto Generated Inline Image 1.png>