I want to be able to plot a stacked horizontal bar chart where some of the columns are missing. Here’s an example from the docs that I’ve modified to show what I mean:
from bokeh.io import show
from bokeh.models import ColumnDataSource
from bokeh.palettes import GnBu3, OrRd3
from bokeh.plotting import figure
fruits = ['Apples', 'Pears', 'Nectarines', 'Plums', 'Grapes', 'Strawberries']
years = ["2015", "2016", "2017"]
exports = {'fruits1' : fruits[:-1],
'fruits2' : fruits[1:],
'2015' : [2, 1, 4, 3, 2],
'2016' : [5, 3, 4, 2, 4],
'2017' : [3, 2, 4, 4, 5]}
imports = {'fruits' : fruits,
'2015' : [-1, 0, -1, -3, -2, -2],
'2016' : [-2, -1, -3, -1, -2, -2],
'2017' : [-1, -2, -1, 0, -2, -2]}
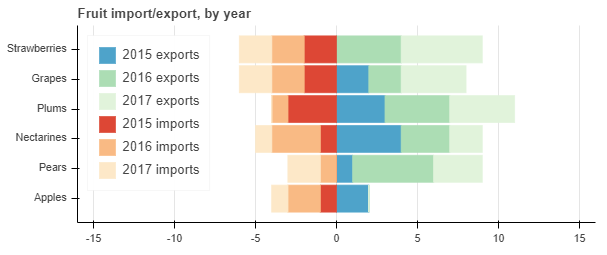
p = figure(y_range=fruits, plot_height=250, x_range=(-16, 16), title="Fruit import/export, by year",
toolbar_location=None)
p.hbar_stack(years, y=['fruits1', 'fruits2', 'fruits1'], height=0.9, color=GnBu3, source=ColumnDataSource(exports),
legend=["%s exports" % x for x in years])
p.hbar_stack(years, y='fruits', height=0.9, color=OrRd3, source=ColumnDataSource(imports),
legend=["%s imports" % x for x in years])
p.y_range.range_padding = 0.1
p.ygrid.grid_line_color = None
p.legend.location = "top_left"
p.axis.minor_tick_line_color = None
p.outline_line_color = None
show(p)
This produces the following plot:
You can see that the stack objects created by the successive calls don’t take into account the change in the column name given in the list passed as y in the call to hbar_stack.
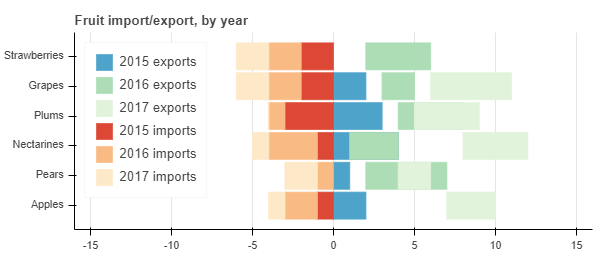
Obviously the solution in this example is to pad with zeros in the right places, but in my application this is not easy because the offset is arbitrarily large. Is there a way around this with Bokeh?