Hi,
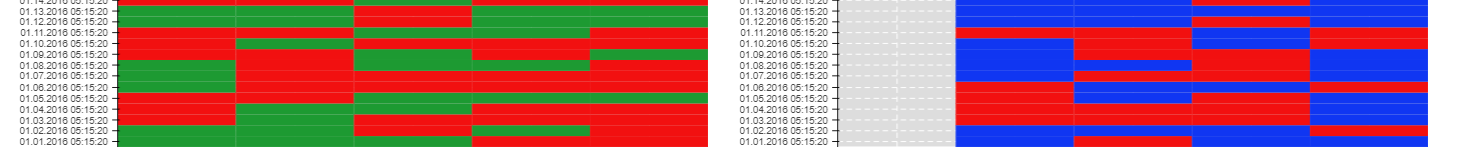
I am plotting a heat map which has a dataset of 0 and 1. I followed an example I found on bokeh. I dont understand why one of the tracks on the heatmap is not showing up (see plot below).
This is the dataset (csv file):
Date,Zone5_test,Zone4_test,Zone3_test,Zone2_test,Zone1_test,Zone5_test2,Zone4_test2,Zone3_test2,Zone2_test2,Zone1_test2
01.01.2016 05:15:20,0,0,1,1,1,0,1,1,0,1
01.02.2016 05:15:20,0,1,0,1,1,1,0,1,1,1
01.03.2016 05:15:20,0,0,0,1,0,1,1,0,0,0
01.04.2016 05:15:20,0,0,1,1,0,1,1,0,0,0
01.05.2016 05:15:20,1,1,1,0,0,1,1,0,1,0
01.06.2016 05:15:20,0,0,0,0,1,0,0,1,1,0
01.07.2016 05:15:20,0,0,0,0,1,0,1,0,0,1
01.08.2016 05:15:20,0,1,1,0,1,0,1,0,1,1
01.09.2016 05:15:20,1,0,1,0,0,0,1,0,0,1
01.10.2016 05:15:20,0,0,0,1,0,1,0,1,0,1
01.11.2016 05:15:20,0,1,1,0,0,0,0,1,0,0
01.12.2016 05:15:20,1,1,0,1,1,0,1,0,1,1
01.13.2016 05:15:20,1,1,0,1,1,0,1,1,1,1
01.14.2016 05:15:20,0,0,1,0,0,0,1,0,1,1
01.15.2016 05:15:20,1,0,1,0,1,1,1,0,0,0
01.16.2016 05:15:20,1,1,0,0,1,1,0,0,1,1
01.17.2016 05:15:20,0,1,1,0,1,0,0,1,1,1
01.18.2016 05:15:20,0,0,0,0,0,1,1,1,1,0
01.19.2016 05:15:20,1,1,0,0,1,0,0,1,1,0
01.20.2016 05:15:20,1,1,1,1,1,0,1,0,0,1
def testoverview(doc):
df = pd.read_csv(‘data\testfile.csv’))
df = df.set_index(‘Date’).astype(str)
df.columns.name = ‘Zones’
dftest = pd.DataFrame(df.stack(), columns=[‘Binary’]).reset_index()
colorstest = ["#F21010", “#1D9A32”]
mappertest = LinearColorMapper(palette = colorstest, low = 0, high = 1)
colorstest2 = ["#F21010", “#1036F2”]
mappertest2 = LinearColorMapper(palette = colorstest2, low = 0, high = 1)
testdf = df[list(df.columns[:5])]
test2df = df[list(df.columns[5:len(df.columns)])]
p = figure(plot_width = 800, plot_height = 12000, title = “test1”,
y_range = list(df.index), x_range = list(reversed(testdf.columns)),
toolbar_location=None, tools="", x_axis_location=“above”)
p2 = figure(plot_width = 800, plot_height = 12000, title = “test2”,
y_range = list(df.index), x_range = list(reversed(test2df.columns)),
toolbar_location=None, tools="", x_axis_location=“above”)
p.rect(x=“Zones”, y = “Date”, width = 1, height = 1, source = dftest,
line_color = None, fill_color = transform(‘Binary’, mappertest))
p2.rect(x=“Zones”, y = “Date”, width = 1, height = 1, source = dftest,
line_color = None, fill_color = transform(‘Binary’, mappertest2))
p.xaxis.axis_label = ‘Zones’
p.yaxis.axis_label = ‘Time’
p2.xaxis.axis_label = ‘Zones’
p2.yaxis.axis_label = ‘Time’
doc.add_root(row(p, p2))
``
First heatmap looks fine, is plotting all 5 columns. The second one isnt showing the last column Zone1_test2. I dont understand why, plots are identical and I have checked numerous times the data is there.

What am I doing wrong?