Heatmap Not Displaying --> Blank Screen

I am trying to create a Heatmap from a csv using python pandas. I keep on getting a blank screen for my output, and I not sure why-- I’ve exhausted the documentation online to try to figure it out. My code is as follows:

    import numpy as np
    from bokeh.io import output_file, show
    from bokeh.models import (
        ColumnDataSource,
        HoverTool,
        LinearColorMapper,
        BasicTicker,
        PrintfTickFormatter,
        ColorBar,
        FactorRange
    )
    from bokeh.plotting import figure
    from bokeh.sampledata.unemployment1948 import data
    from bokeh.transform import transform

    #Initialize DataFrame
    df = pd.read_csv("myData.csv") 

    df.dropna().astype(float)
    df.columns.name = 'Month'
    df.index.name = 'Facility'

    df_1 = pd.DataFrame(df.stack(), columns=['state']).reset_index()
    source = ColumnDataSource(df_1)  

    #Heatmap
    colors = ["#75968f", "#a5bab7", "#c9d9d3", "#e2e2e2", "#dfccce", "#ddb7b1", "#cc7878", "#933b41", "#550b1d"]
    mapper = LinearColorMapper(palette=colors, low=df_1.state.min(), high=df_1.state.max())

    TOOLS = "hover,save,pan,box_zoom,reset,wheel_zoom"

    p = figure(title="WSSDM4",
               x_range= list(df.columns), y_range=list(df.index),
               x_axis_location="above", plot_width=1800, plot_height=800,
               tools= TOOLS, toolbar_location='below',
               tooltips=[('Facility', '@Facility'), ('Month', '@Month')])

    p.rect(x='Facility', y = 'Month',width=1, height=1, source=source,
            line_color=None, fill_color=transform('state', mapper))
       
    color_bar = ColorBar(color_mapper=mapper, major_label_text_font_size="7px",
                         ticker=BasicTicker(desired_num_ticks=len(colors)),
                         label_standoff=6, border_line_color=None, location=(0, 0))

    p.add_layout(color_bar, 'right')

    p.axis.axis_line_color = None
    p.axis.major_tick_line_color = None
    p.axis.major_label_text_font_size = "7px"
    p.axis.major_label_standoff = 0
    p.xaxis.major_label_orientation = 1.0
    show(p)

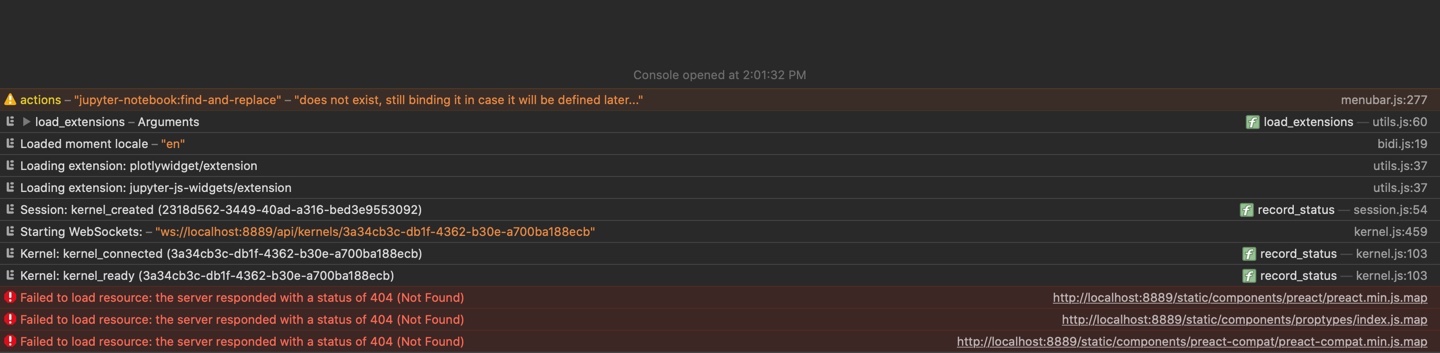
I am using Jupyter notebooks and have all the up-to-date libraries.
Things I’ve Done to QAQC:

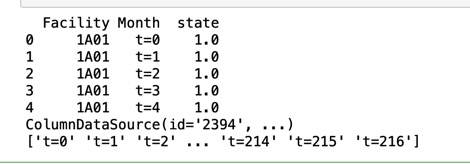
  • The input I am using is formatted correctly – I tested it out by displaying df.head() after every section- it has all the correct labels (index, columns) and data types (object, float).
  • When I check that the ColumnDataSource is mapped correctly, I get the outputs that I would expect (list of the state, facility, month, etc).
  • Month is not a date field, but a string

Thank you!

Hi @Alessandra_Coote please edit your post to use code formatting so that the code is intelligible (either with the </> icon on the editing toolbar, or triple backtick ``` fences around the code blocks)

Sorry about that, there you go!

Can you provide myData.csv? Or at least show df.head()? Whatever the issue is almost certainly has to do with something about the data. Are there any messages in the browser JS console?

Here is the df_1.head() and print(source.data[‘Month’])
E67F3F0A-3B76-4A5F-9C9C-6A85A89D5C22_4_5005_c

Here is the JS console:

When I used the example listed in the Bokeh documentation, everything worked fine.

here is df.head(), df_1.head(), and source.data[‘Month’]

You set the y range as y_range=list(df.index) is df.index a sequence of strings? Bokeh only accepts string values as categorical factors. Otherwise, it will be much simpler to diagnose if you can put a sample date file some place for direct examination.

I am unable to upload the myData.csv file, but it’s a sequence of strings. I have tried with the same result.

p = figure(title="WSSDM4",
           x_range= list(df.columns.astype(str)), y_range = list(df.index.astype(str)),
           x_axis_location="above", plot_width=5000, plot_height=3000,
           tools= TOOLS, toolbar_location='below',
           tooltips=[('Facility', '@Facility'), ('Month', '@Month')])

Perhaps you can construct a small fake synthetic data set with the same properties and types? I don’t really have any other suggestions without being able to try out things locally, apart from taking a step back and starting from a working example, and making small incremental changes towards your real data one step at a time, so you can see exactly where things break down.

Haha, the discourse won’t let me upload any file types except for pictures.

I’ve taken a few working examples and have worked backwards from there, but I still get blank pages.

Could it be due to the size? df_1 is over 33,000 rows.

Perhaps upload in a gist? https://gist.github.com/

Also, just to make sure we’re not missing any useful messaging-- often when I get a “blank page” type problem, there’s something in the browser’s javascript console. Is there anything at all there?

I found the issue!

I switched the index and columns for x and y-- I had my x axis as my columns and y axis as my index, when bokeh requires x to map to index and y to map to columns. Once I switched, I got my Heatmap!

2 Likes

Awesome! Glad to hear it’s working for you.