Using Bokeh 2.3.3. I have inherited some Python code using Bokeh from an engineer who has left. I don’t understand Bokeh well.
We have a graph which is rendering the same data twice, once as step, once as scatter, so we get a line with the points marked on it.
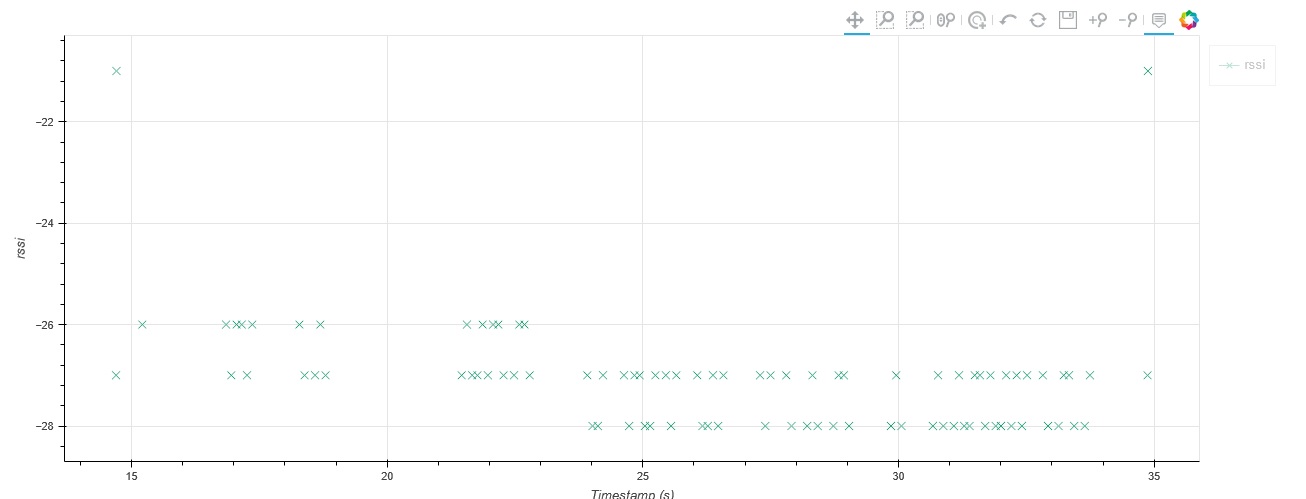
When I click on the legend to hide the line only the line is hidden, the points are not.
The LegendItem looks to have both renderers.
This is the simple case. In more complex cases it looks as though the line and the points are hidden and the points from a different graph as shown instead.
Seems to be a problem with the webgl backend. If I don’t specify webgl it works OK. However we have webgl specified for performance reasons because some of our graphs have 10,000s of points.
I have tried upgrading to 2.4.3 but then the Bokeh figures don’t appear. Also tried 3.1.0 but then our code doesn’t run because lots of names seem to have changed.
This code shows the issue (with Bokeh 2.3.3):
from bokeh.plotting import figure, show, Figure
from bokeh.models import Legend

x = [1, 2, 3, 4, 5]
y = [6, 7, 2, 4, 5]

p: Figure = figure(title="Simple line example", x_axis_label="x", y_axis_label="y", output_backend='webgl')

p.add_layout(Legend(click_policy='hide'), 'right')

p.step(x, y, name='rssi', legend_label='rssi', alpha=0.9, nonselection_alpha=0.5)
line_alpha = 1.0
fill_alpha = 0.5
p.scatter(x, y, name='rssi', legend_label='rssi', marker='x', size=8,
          line_alpha=line_alpha, fill_alpha=fill_alpha,
          nonselection_line_alpha=line_alpha * 0.5, nonselection_fill_alpha=fill_alpha * 0.5)

show(p)