I have a line using step which has +ve and +ve values. Is there a way to not draw the portion where y = 0?
x = [1, 2, 3, 4, 5, 6]
y3 = [0, 2, 0, -2, 0, 0]

s2 = figure(width=200, height=200, sizing_mode='stretch_width')
s2.step(x=x, y=y3, mode="after", alpha=0.9, nonselection_alpha=0.5)
Graph
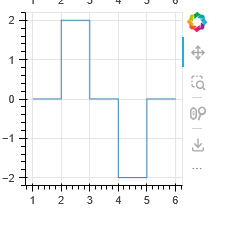
So only show the lines from 0->2->2->0 and 0->-2->-2->0 and hide the sections from 0->0.