Hi
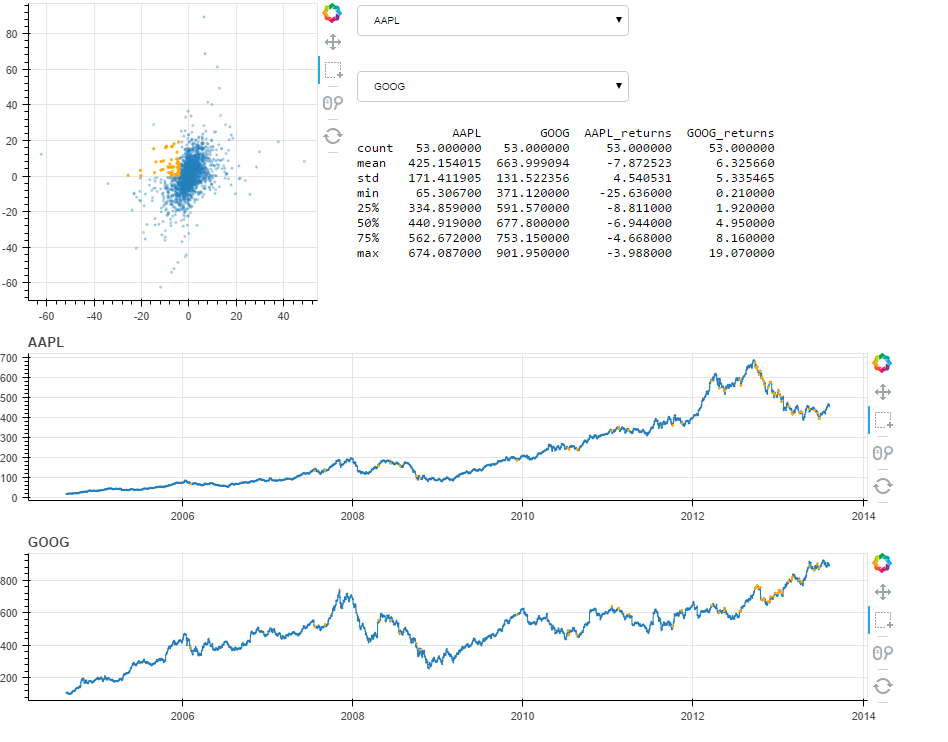
I am trying to create a scatter plot and a line graph with live interaction like the example attached.
I would like to select the points in the scatter plot and have the background of the line chart filled in at each selected point. My goal is to be able to create multiple selections and have the background filled in with various colors.
I have attempted this using segments but I can’t seem to get the segments to show up using a common source and linking them in javascript. It works if I create a test data set and apply it directly.
Any suggestions on a solution would be helpful!
Darren