Highlight parts of an image with a sliding-window across its histogram

Hi,

I have a squared image which is essentially a 2d numpy array. I want to highlight different parts of the image according to its value in each pixel.

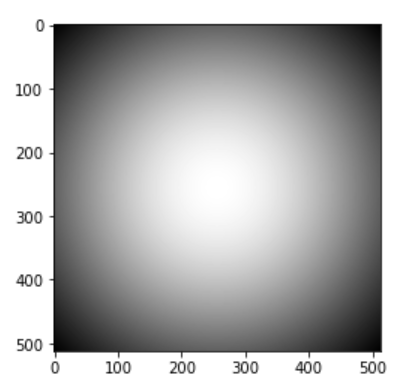
This is the an example image: 2d guassian

import numpy as np
%matplotlib inline
import matplotlib.pyplot as plt

x, y = np.meshgrid(np.linspace(-1,1,512), np.linspace(-1,1,512))
d = np.sqrt(x*x+y*y)
sigma, mu = 1.0, 0.0
g = np.exp(-( (d-mu)**2 / ( 2.0 * sigma**2 ) ) )

plt.imshow(g, 'gray')

image

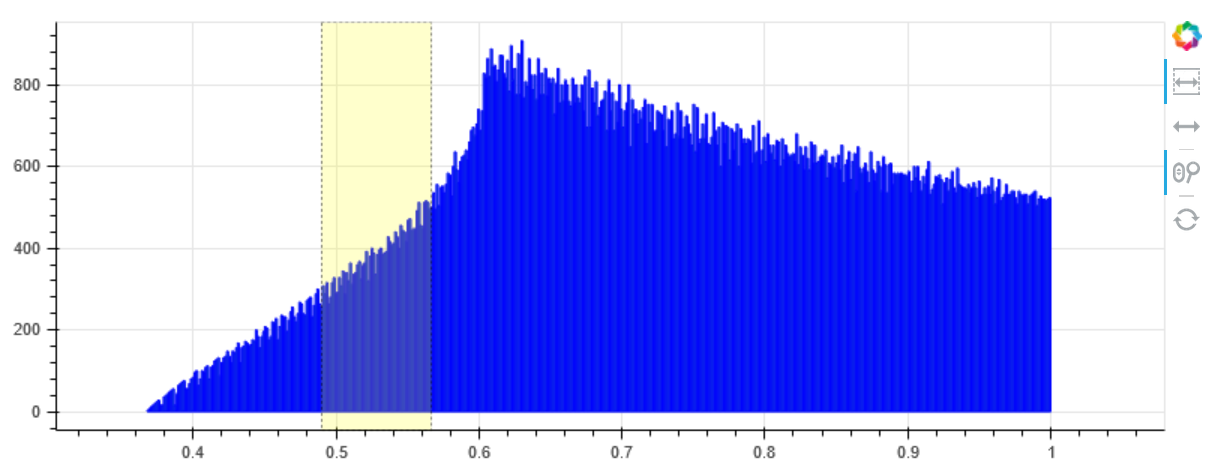
This is its intensity histogram

import numpy as np

from bokeh.io import show, output_notebook
from bokeh.layouts import column
from bokeh.models import ColumnDataSource, RangeTool
from bokeh.plotting import figure
output_notebook()

sample_img_nonan = g[~np.isnan(g)]
hist, edges = np.histogram(sample_img_nonan, bins=500)
p = figure(plot_height=300, plot_width=800, 
           tools='xpan, xwheel_zoom, reset', 
           active_scroll='xwheel_zoom',
           active_drag='xpan')
p.quad(top=hist, bottom=0, left=edges[:-1], right=edges[1:], line_color="blue")

range_tool = RangeTool(x_range=Range1d(np.mean(sample_img_nonan)-np.std(sample_img_nonan), 
                                       np.mean(sample_img_nonan)+np.std(sample_img_nonan)))
range_tool.overlay.fill_color = "yellow"
range_tool.overlay.fill_alpha = 0.2

p.add_tools(range_tool)
p.toolbar.active_multi = range_tool

show(p)

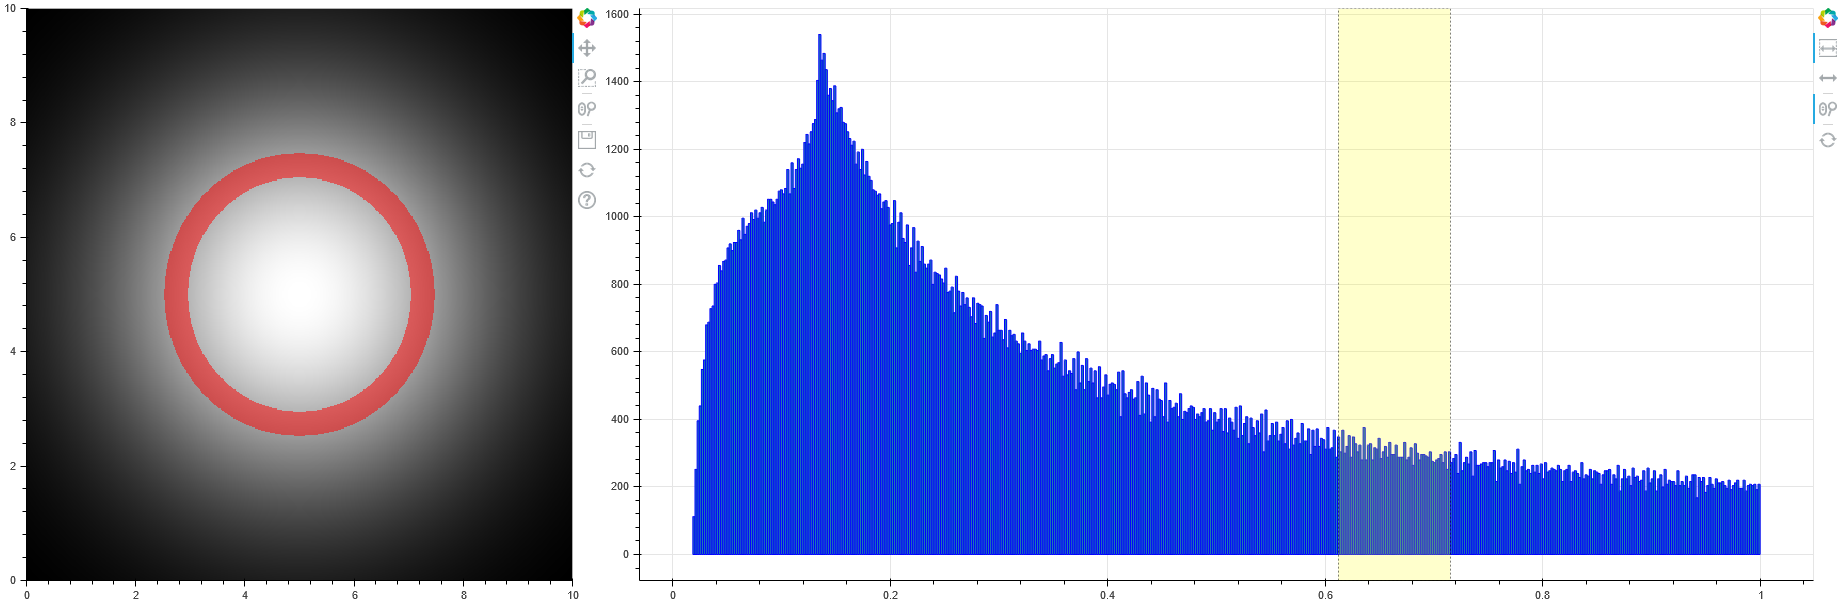
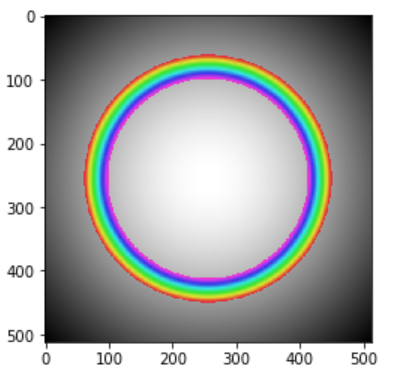
The yellow rectangular can be adjusted in size and slided along the x direction, and I want to use it to specify the intensity range which will be highlighted on the origin image. Like below:

mask = np.ma.masked_outside(g, 0.75, 0.83 )
fig, ax = plt.subplots(figsize=(10,10))
ax.imshow(g, 'gray')
ax.imshow(mask,'gist_rainbow', interpolation='none', alpha=0.7)

image

Now I have no idea how to link the histogram to the image, I have looked into here and here. But I’m not sure if that is the right direction. Please give me some hint so I can go into the right direction for this issue. Thanks in advanced!

If this were a Bokeh server application (which does not seem to be the case) then you could use real python libraries like Numpy to do masking and color mapping, and then update an ImageRGBA directly. But for standalone Bokeh output (what you have above) then all that is available is Javascript callbacks, which means that all the work to change the image has to be done with JavaScript code in the browser.

I am afraid there may not be any simple way to accomplish this. The best thing I can think of that might work is to display a static grayscale version of the image as a bottom layer. Then on top display another Image with a color mapper that is configured to map to transparent above and below the low/high values. Then in principle, the JS callback could potentially just change the colormaper low/high values in a line or two of code. But you will just have to try, I don’t have any existing example of this specific approach to point you to.

Also FYI, please consider a different colormap if you can. Rainbow is an extremely poor colormap for almost any purpose, for a lot of different reasons (e.g it is not perceptually uniform, and not ergonomic for color-deficient viewers).

Thanks, it works!

from bokeh.server.server import Server
from bokeh.models import ColumnDataSource, Label, HoverTool, RangeTool, Range1d
from bokeh.plotting import figure
from bokeh.layouts import column, row
from bokeh.palettes import Greys256, Reds
from bokeh.colors import RGB
from bokeh.models.mappers import LinearColorMapper

import numpy as np
from functools import partial

def make_document(doc, a):
    def range_callback(attr, old, new):
        newimg = np.flipud(a).copy()
        newimg[newimg > range_tool.x_range.end] = np.nan
        newimg[newimg < range_tool.x_range.start] = np.nan
        source.data['image'] = [newimg]
    
    cm = LinearColorMapper(palette=[RGB(255,0,0,0.5)], nan_color=RGB(0,0,0,0))
    a_nonan = a[~np.isnan(a)]

    source = ColumnDataSource(data=(dict(image=[a],
                                            x=[0],
                                            y=[0],
                                            dw=[10],
                                            dh=[10])))
    fig = figure(match_aspect=True, x_range=(0,10), y_range=(0,10))
    fig.image([np.flipud(a)], 0, 0, 10, 10, palette=Greys256)
    fig.image(source=source, image='image', x='x', y='y', dw='dw', dh='dh', color_mapper=cm)
    
    a_nonan = a[~np.isnan(a)]
    hist, edges = np.histogram(a_nonan, bins=500)
    p = figure(plot_height=300, plot_width=800, 
               tools='xpan, xwheel_zoom, reset', 
               active_scroll='xwheel_zoom',
               active_drag='xpan')
    p.quad(top=hist, bottom=0, left=edges[:-1], right=edges[1:], line_color="blue")

    range_tool = RangeTool(x_range=Range1d(np.mean(a_nonan)-np.std(a_nonan), 
                                           np.mean(a_nonan)+np.std(a_nonan)))
    range_tool.overlay.fill_color = "yellow"
    range_tool.overlay.fill_alpha = 0.2
    range_tool.x_range.on_change('start', range_callback)
    range_tool.x_range.on_change('end', range_callback)
    
    p.add_tools(range_tool)
    p.toolbar.active_multi = range_tool
        
    row_1 = row([fig])
    row_2 = row([p], sizing_mode='stretch_both')
    doc.add_root(row([row_1, row_2]))

if __name__ == '__main__':

    x, y = np.meshgrid(np.linspace(-1,1,512), np.linspace(-1,1,512))
    d = np.sqrt(x*x+y*y)
    sigma, mu = 0.5, 0.0
    g = np.exp(-( (d-mu)**2 / ( 2.0 * sigma**2 ) ) )
    
    server = Server({'/': partial(make_document, a=g)})
    server.start()
    server.io_loop.add_callback(server.show, "/")
    server.io_loop.start()
1 Like