Hi everyone,
I was trying to get an histogram closer to the one you obtain using ROOT CERN, something like this:
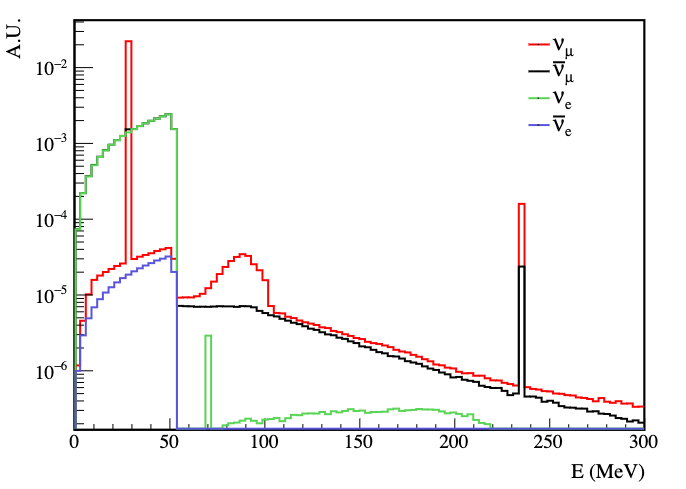
An histogram where you have only the cap of the bins and the some of the edges
Hi everyone,
I was trying to get an histogram closer to the one you obtain using ROOT CERN, something like this:
An histogram where you have only the cap of the bins and the some of the edges
I’d be reaching into my bag of pandas tricks and transforming the binned data to be plotting using a Line/MultiLine glyph.
Seems like a use case for figure.step
https://docs.bokeh.org/en/latest/docs/user_guide/basic/lines.html#step-lines
Edit: though note, hit-testing does not yet function with step glyphs — Hover tooltip not showing for step line · Issue #7419 · bokeh/bokeh · GitHub If a hover tool is a requirement, you’d need to resort to more manual drawing with line (which still might not behave perfectly with hover tools due to vertical segents)
This is almost what I was looking, is there a way to also plot the edges at the beginning and the end of the first and last steps?
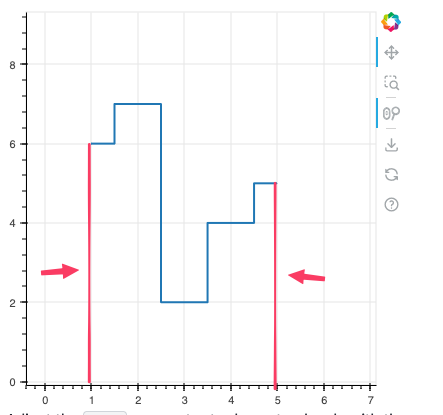
No, I think you’d have to fudge those manually with some extra segment or line calls. If you don’t require mode="center" then adding some zero points to the step might also work, at least on one end.
This topic was automatically closed 90 days after the last reply. New replies are no longer allowed.