What you are describing is not really consistent with my understanding or experience, so what would really be helpful is a complete code example (i.e. that could actually be run to test) showing what you tried.
I’ve tried the example from https://bokeh.pydata.org/en/latest/docs/user_guide/graph.html#interaction-policies and indeed, I can have both tooltips.
So I’ve simplified my code in order to obtain an example that shows the problem. My goal is to have a subclass of networkx.DiGraph with a draw method, I’ve added some geometric computation to have the edges starting/ending on the border of the nodes.
import networkx as nx
import pandas as pd
import numpy as np
import bokeh.io as bkio
import bokeh.plotting as bkp
import bokeh.models as bkm
import bokeh.palettes as bkpal
class Graph (nx.DiGraph) :
def init (self) :
# builds a dummy graph
super().init()
for name, labels in [(“a”, {1, 2}), (“b”, {2, 3}), (“c”, {3, 4}),
(“d”, {4, 5}), (“e”, {6, 7})] :
self.add_node(name, labels=labels)
for src, tgt in [“ab”, “ac”, “bc”, “bd”, “be”, “ce”, “ed”] :
self.add_edge(src, tgt,
labels=self.node[src][“labels”] | self.node[tgt][“labels”])
def draw (self, engine=“dot”, nodes_size=.02, arrow_size=.01, palette=None) :
# 1. convert graph to dataframes
# 1.1. init nodes dataframe with layout
nodes = pd.DataFrame.from_dict(nx.nx_pydot.pydot_layout(self, prog=engine),
orient=“index”, columns=[“x”, “y”])
# 1.2. normalize layout in [0;1]
for coord in [“x”, “y”] :
nodes[coord] -= nodes[coord].min()
nodes[coord] /= nodes[coord].max()
# 1.3. concert labels to str
nodes[“labels”] = [", ".join(sorted(str(l) for l in self.node[node][“labels”]))
for node in nodes.index]
# 1.4. create edges dataframe
idx = nodes.to_dict(orient=“index”)
edges = pd.DataFrame(((src, idx[src][“x”], idx[src][“y”],
tgt, idx[tgt][“x”], idx[tgt][“y”],
“, “.join(sorted(str(l) for l in label)))
for src, tgt, label in self.edges(data=“labels”)),
columns=[“start”, “x_start”, “y_start”,
“end”, “x_end”, “y_end”,
“labels”])
# 1.5. compute edges slopes
edges[“slope”] = np.arctan2(edges[“y_end”]-edges[“y_start”],
edges[“x_end”]-edges[“x_start”])
# 1.6. compute edges start/end points wrt to nodes size
edges[“x_start”] += np.cos(edges[“slope”]) * nodes_size
edges[“y_start”] += np.sin(edges[“slope”]) * nodes_size
edges[“x_end”] -= np.cos(edges[“slope”]) * nodes_size
edges[“y_end”] -= np.sin(edges[“slope”]) * nodes_size
edges[“size”] = np.full(len(edges), arrow_size)
# 2. draw graph with bokeh
# 2.1. get palette
pal = getattr(bkpal, palette or “Spectral4”, bkpal.Spectral4)
# 2.2. create plot
plot = bkp.figure(title=“Graph”,
x_range=(-2nodes_size, 1 + 2nodes_size),
y_range=(-2nodes_size, 1 + 2nodes_size),
x_axis_location=None, y_axis_location=None,
outline_line_dash=“dotted”)
plot.grid.visible = False
# 2.3. create graph renderer
graph = bkm.GraphRenderer()
# 2.4. create and add nodes CDS
nodes_dict = {k: nodes[k] for k in nodes.columns}
nodes_dict[“index”] = nodes.index
nodes_data = bkm.ColumnDataSource(data=nodes_dict)
graph.node_renderer.data_source.data = nodes_data.data
# 2.5. create and add edges CDS
edges_dict = {k: edges[k] for k in edges.columns}
edges_dict[“xs”] = [(edges[“x_start”][e], edges[“x_end”][e])
for e in edges.index]
edges_dict[“ys”] = [(edges[“y_start”][e], edges[“y_end”][e])
for e in edges.index]
edges_data = bkm.ColumnDataSource(data=edges_dict)
graph.edge_renderer.data_source.data = edges_data.data
# 2.6. create layout as expected by GraphRenderer
layout = {n : (nodes[“x”][n], nodes[“y”][n]) for n in nodes.index}
graph.layout_provider = bkm.StaticLayoutProvider(graph_layout=layout)
# 2.7. add arrows
arrows = bkm.Arrow(end=bkm.NormalHead(size=arrow_size*1000),
x_start=“x_start”,
y_start=“y_start”,
x_end=“x_end”,
y_end=“y_end”,
source=edges_data)
plot.add_layout(arrows)
# 2.8. set glyphs for nodes and edges
graph.node_renderer.glyph = bkm.Circle(radius=nodes_size,
fill_color=pal[0],
fill_alpha=.5)
graph.node_renderer.selection_glyph = bkm.Circle(radius=nodes_size,
fill_color=pal[2],
fill_alpha=.5)
graph.node_renderer.hover_glyph = bkm.Circle(radius=nodes_size,
fill_color=pal[1],
fill_alpha=.5)
graph.edge_renderer.glyph = bkm.MultiLine(line_color=”#CCCCCC”,
line_alpha=0.8, line_width=5)
graph.edge_renderer.selection_glyph = bkm.MultiLine(line_color=pal[2],
line_width=5)
graph.edge_renderer.hover_glyph = bkm.MultiLine(line_color=pal[1],
line_width=5)
# 2.9. set policies and finish it
graph.selection_policy = bkm.NodesAndLinkedEdges()
graph.inspection_policy = bkm.NodesAndLinkedEdges()
plot.renderers.append(graph)
plot.add_tools(bkm.TapTool(),
bkm.LassoSelectTool(),
bkm.BoxSelectTool(),
bkm.HoverTool(tooltips=[(“node”, “@index”),
(“labels”, “@labels”)]))
bkio.output_file(“interactive_graphs.html”)
bkio.show(plot)
return graph, plot
Graph().draw()
``
Ideally, I’d like to have graph.inspection_policy = bkm.```EdgesAndLinkedNodes()`` `and distinct tooltips for nodes and edges (index&labels for nodes, just labels for edges).
But when I set this policy, I just get edges tooltips, and if I set the policy as in the code above, I just get nodes tooltips.
I don’t see what makes a difference difference between my code and adding tooltips to the example from https://bokeh.pydata.org/en/latest/docs/user_guide/graph.html#interaction-policies, which works.
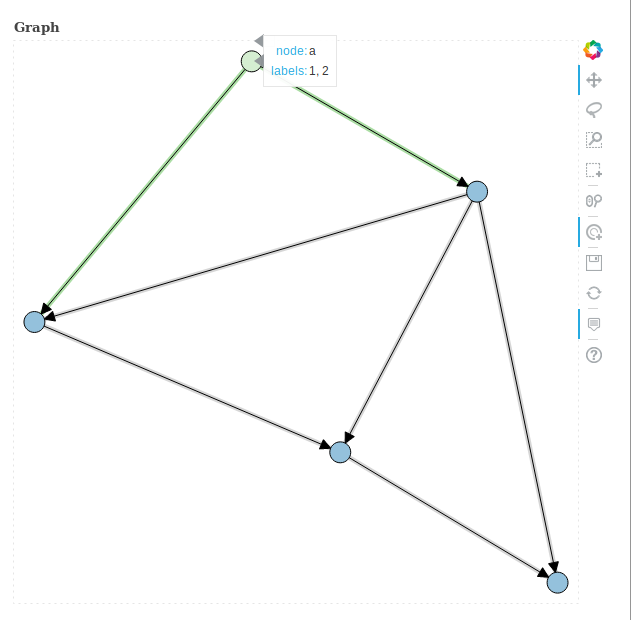
Finally, I’ve noticed that on tootips that are displayed at the right of a node, there are two arrows pointing to the node :
Thank you for your help!
Franck