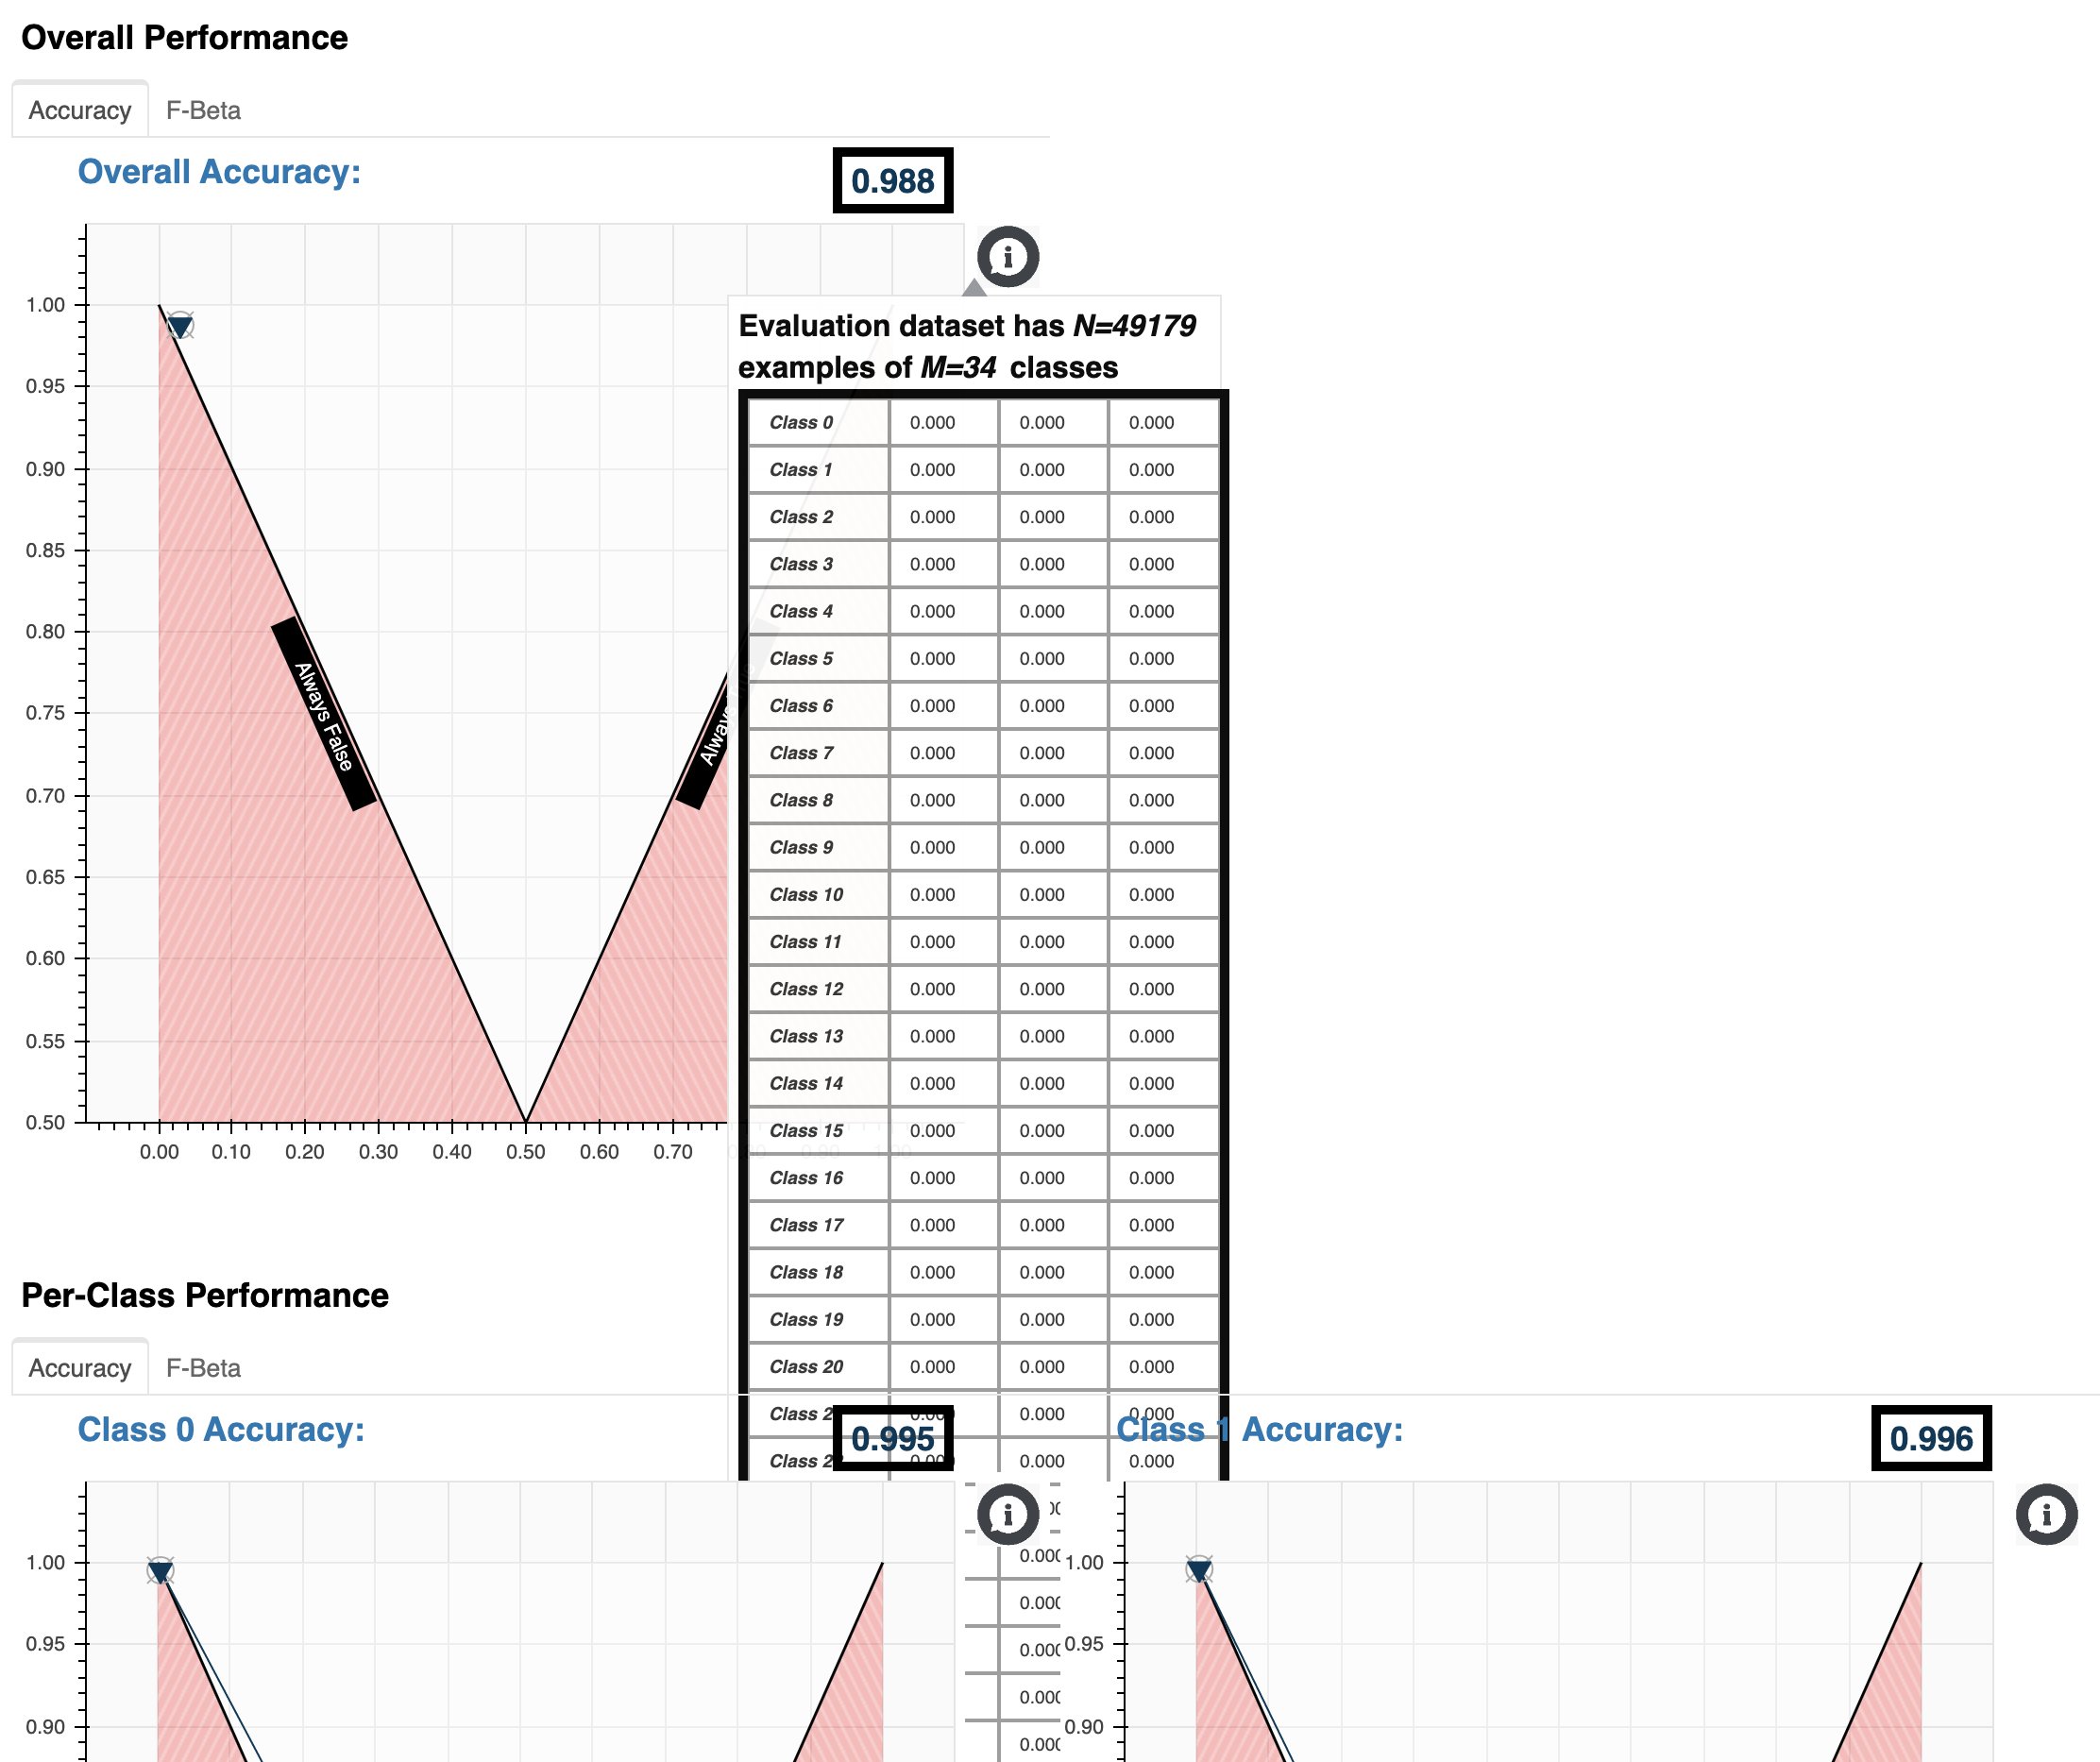
For certain bokeh layouts, I observe that the hover tool of one plot is overlaid/obscured by other graphics on the page. See attached screen shot.
The hover-tool object does not appear to have a renderer level attribute that would allow me to work around this problem. Am I missing something here, or is there a way to control the levels to work around this?
It’s a hard problem and a “one size fits all” solution might not be possible at all. I’ll try to experiment a bit, but can’t promise anything. If you want to know more details and track the current status of the issue, here’s the report on GitHub: interaction between tooltips and gridplots · Issue #4930 · bokeh/bokeh · GitHub
Thanks for the quick feedback and illustrative example.
Perhaps your counter-example works because the models are all part of the same gridplot container. In my example, I have two roots (each a tab panel) that are sequentially added to a bokeh document, and it appears the second one is layered on top of the first.
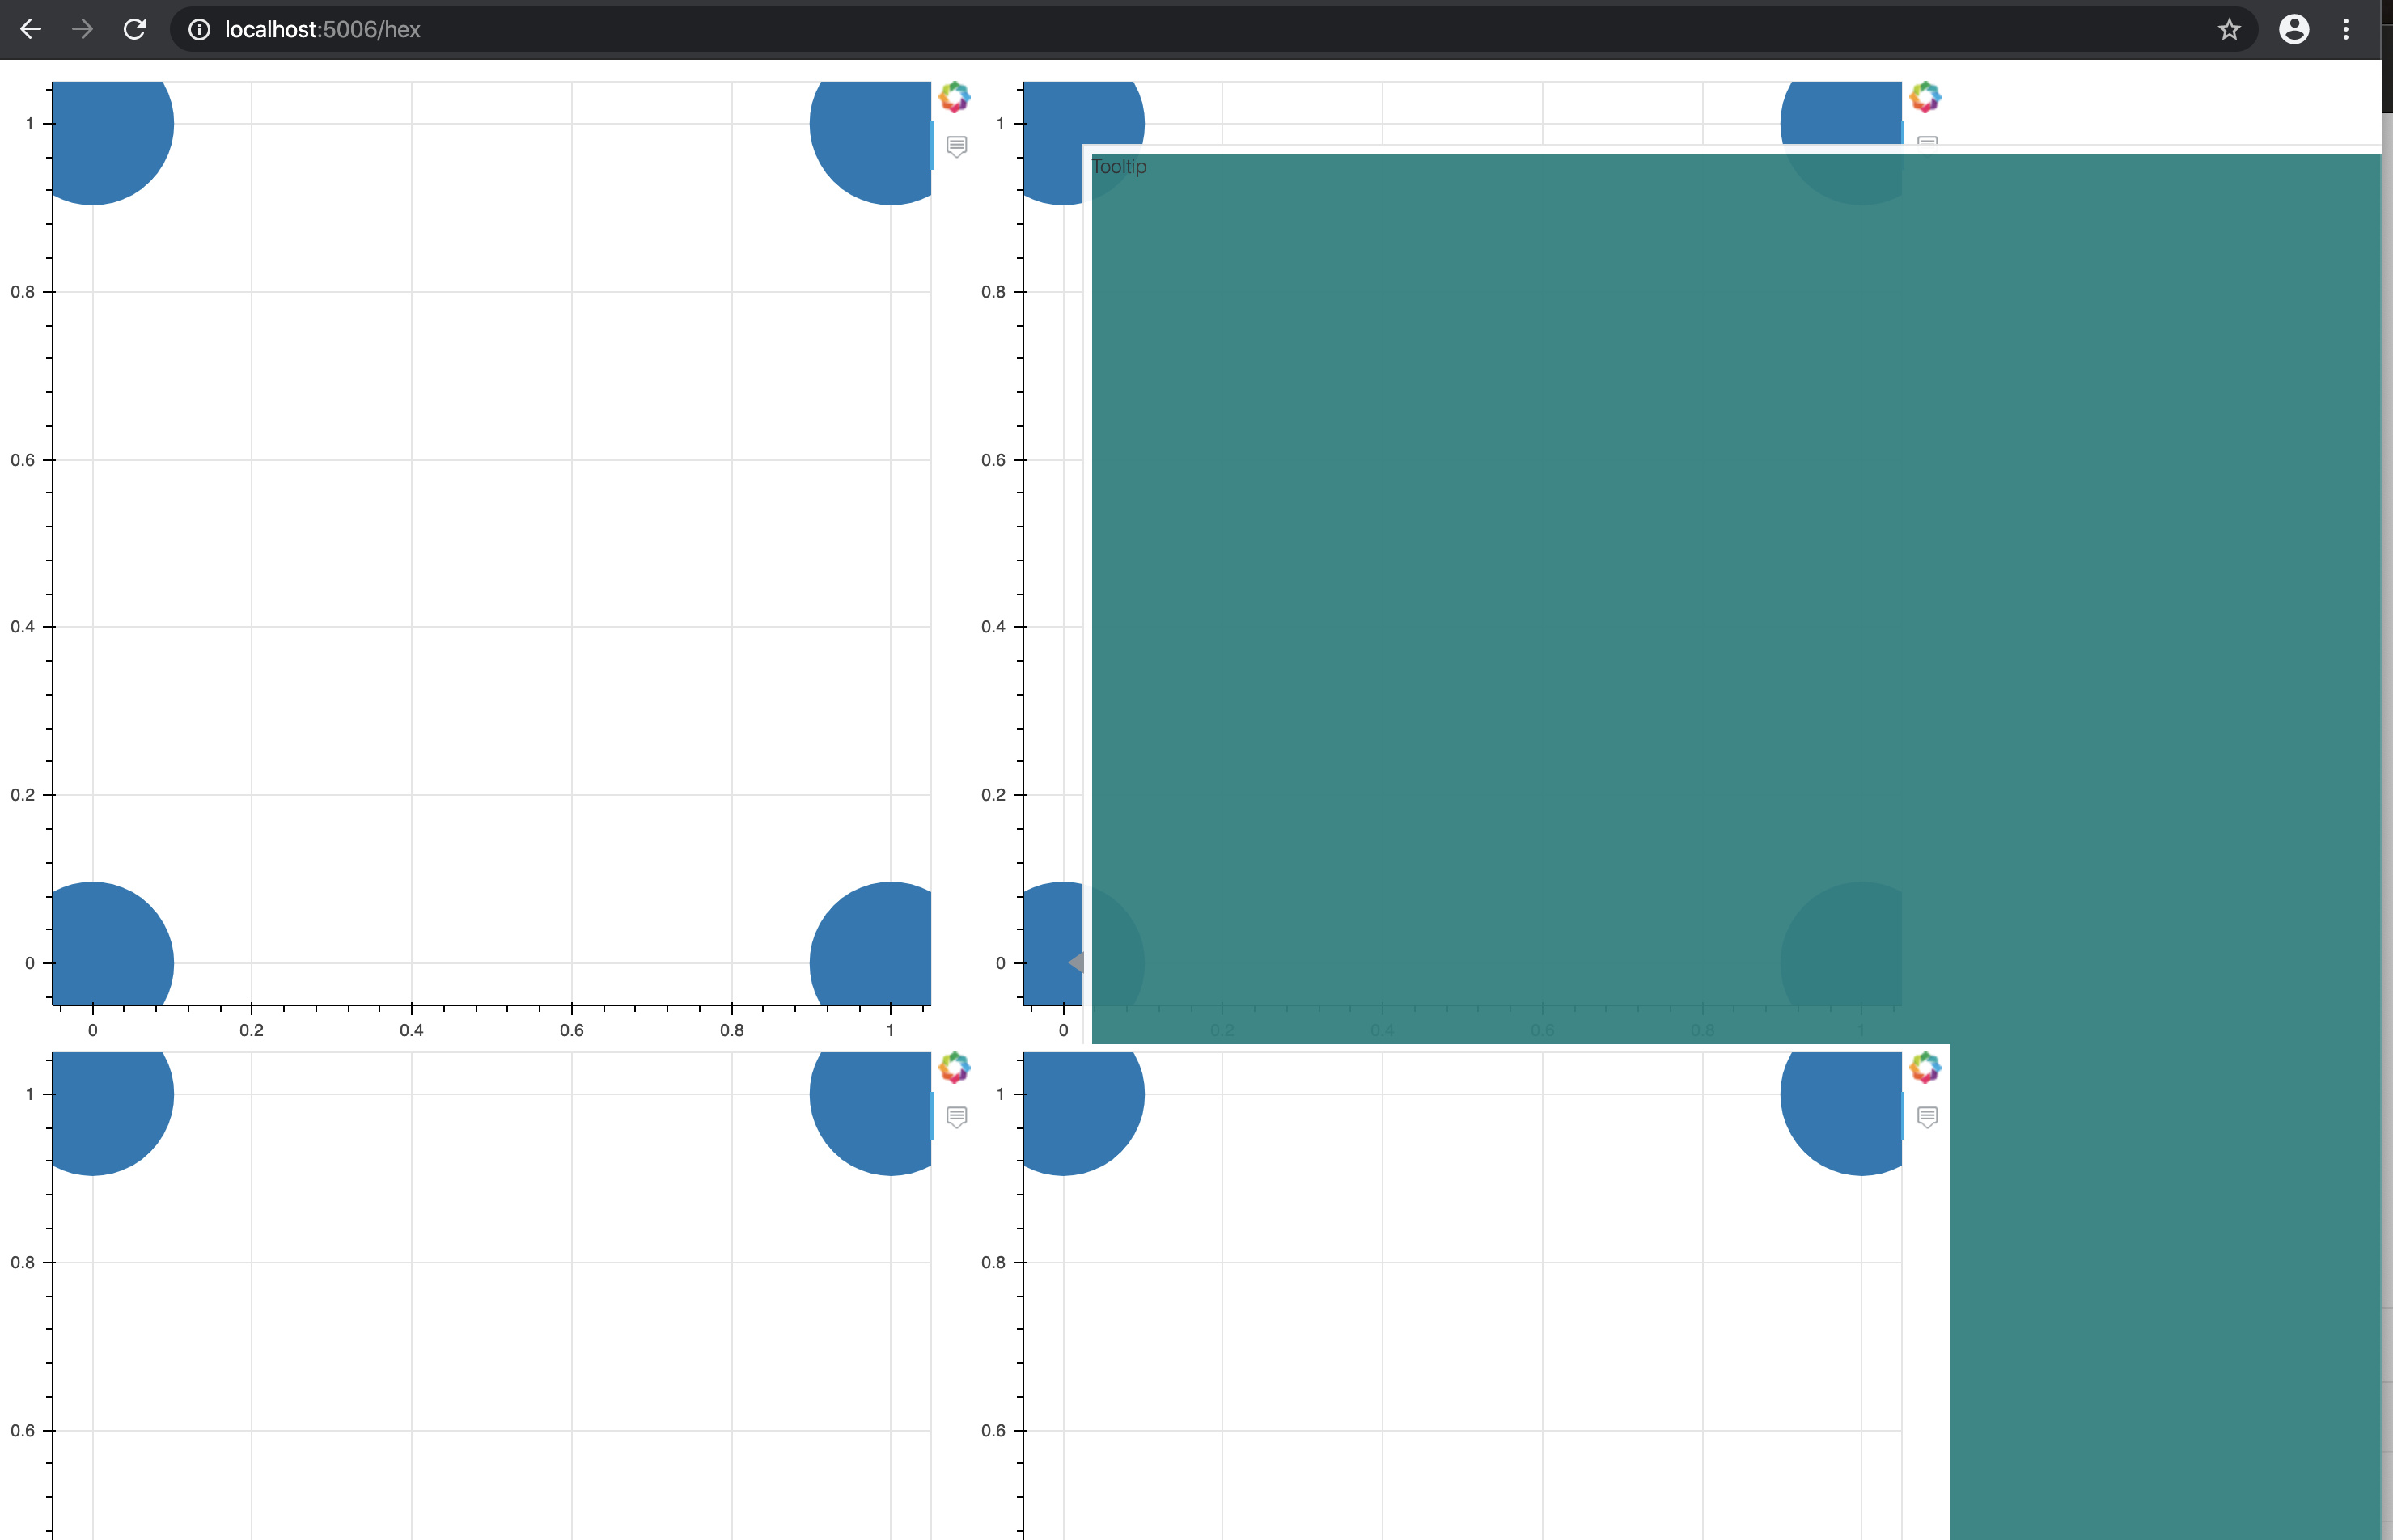
I made modest modifications to your example to test that hypothesis, and can recreate the issue with the attached code (run as a bokeh server session). See also attached screen capture.
#!/usr/bin/env python3
# -*- coding: utf-8 -*-
"""
"""

from bokeh.io import show
from bokeh.layouts import gridplot, column, row
from bokeh.models import HoverTool
from bokeh.plotting import figure, curdoc

ht = HoverTool(tooltips='<div style="width: 1000px; height: 1000px; background-color: teal;">Tooltip</div>')
p1 = figure(tools=[ht])
p2 = figure(tools=[ht])
p3 = figure(tools=[ht])
p4 = figure(tools=[ht])
for p in [p1, p2, p3, p4]:
    p.circle(x=[0, 1, 1, 0], y=[0, 0, 1, 1], size=100)

#show(gridplot([[p1, p2], [p3, p4]]))
curdoc().add_root(row(p1,p2))
curdoc().add_root(row(p3,p4))
Well, then you have yourself a workaround already. Just use gridplot, grid, or a combination of row and column to get the same layout you would get by calling add_root multiple times.
The reason for sequential add_root calls in my current layout is that I am presenting information in tabs/panels and each root-level might not have the same panels/information in general.
I will think about how to reconfigure how I present information to a user.
To be honest, I don’t really understand how it precludes you from combining panels with the layout primitives. If you could elaborate, maybe with a toy example, I could maybe come up with some ideas.
I think the disconnect might be a misunderstanding on my side. I assumed that tabs/panels could not be embedded in a grid, row, or column primitive. If that’s an incorrect assumption, then a workaround is straightforward.
 Just use