Hello,
I am trying to generate a plot with MultiLine in which each point in the line gets a different label.
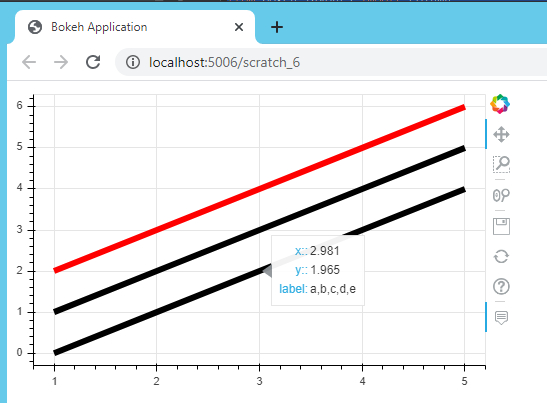
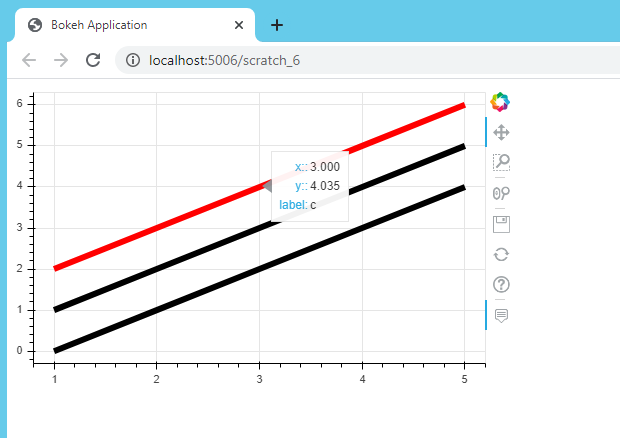
This feature worked fine when using the regular Line renderer, but when I use the MultiLine, all labels are shown simulationusly.
I am using Python 3.7 with bokeh version 1.3.4.
But I can confirm that the same problem persist when using bokeh 2.0.1.
I would really appreciate help with this.
Here is an example code and screenshots:
from bokeh.io import curdoc
from bokeh.models import HoverTool
from bokeh.layouts import column
import bokeh.plotting

figure = bokeh.plotting.figure(width=500, height=300)
multi_line = bokeh.models.MultiLine(xs='t', ys='f', line_width=6)
line = bokeh.models.Line(x='t', y='f', line_width=6, line_color='red')

data_multi_line = {'t': [[1,2,3,4,5], [1,2,3,4,5]],
        'f': [[1,2,3,4,5], [0,1,2,3,4]],
        'label': [['a', 'b', 'c', 'd', 'e'], ['a', 'b', 'c', 'd', 'e']]}

data_line = {'t': [1,2,3,4,5],
        'f': [2,3,4,5,6],
        'label': ['a', 'b', 'c', 'd', 'e']}

ds_multi_line = bokeh.models.ColumnDataSource(data_multi_line)
ds_line = bokeh.models.ColumnDataSource(data_line)
hover = HoverTool(tooltips=[('x:', '$x'), ('y:', '$y'), ('label', '@label')])


figure.add_tools(hover)

figure.add_glyph(ds_multi_line, multi_line)
figure.add_glyph(ds_line, line)
curdoc().add_root(column(figure))