Hover Tooltips Question Mark for @ function

I am trying to show the text of excel using hovertool, but it shows question mark when I use @ function
屏幕截图 2022-02-22 112707

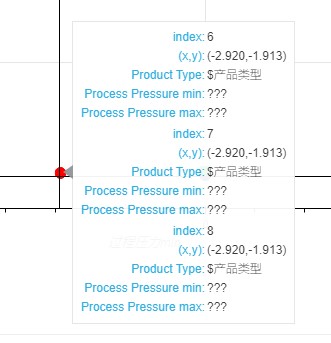
I used hover = HoverTool(tooltips = [(“index”,"$index"),
("(x,y)","($x,$y)"),
(“Product Type”,"@产品类型"),
(“Process Pressure min”,"@x{%F}"),
(“Process Pressure max”,"@y{0,0.00}"),])

The first two work, but the last three do not work.

All data have the same length.

And I am using Bokeh 2.2.3 and Jupyter Notebook 3.8.5

My code:

data1_2 = pd.DataFrame({
    'Product Type': ["Solid","Solid","Solid","Solid","Solid","Solid","Solid","Solid","Solid","Solid"],
    'Process Pressure max': [58,58,58,58,43,22,29,29,29,7.25],
    'Process Pressure min': [10,10,10,10,10,10,-2.9,-2.9,-2.9,0],
})
source1 = ColumnDataSource(data1_2)
hover = HoverTool(tooltips = [("index","$index"),
                              ("(x,y)","($x,$y)"),
                              ("Product Type","@Product Type"),
                              ("Process Pressure min","@x{%F}"),
                              ("Process Pressure max","@y{0,0.00}"),])
tools = [hover,"crosshair,lasso_select,wheel_zoom,pan,reset"]
##########################################################
p1 = figure(plot_width=1600, plot_height=800, tools=tools,title = "Scatter 1 - Process Pressure min&max",
            x_axis_label = 'Process Pressure min',y_axis_label = 'Process Pressure max')
p1.circle(x='Process Pressure min', y='Process Pressure max', source = source1,
         size = 10, color = 'navy', hover_color = "red", legend = "Ultrasonic")

tab1 = Panel(child = p1, title = "Process Pressure min&max")
tabs = Tabs(tabs=[tab1])
show(tabs)
path = r"C:\Users\Jenny\Desktop\Data Files\Bokeh.html"
output_file(filename = path, title = "2022.02.22")

Where did I code wrong?

Hi @Jenny98 please edit your post to use code formatting so that the code is intelligible (either with the </> icon on the editing toolbar, or triple backtick ``` fences around the code blocks). Additionally, for the best chance at helping us help you, please proved a complete Minimal Reproducible Example that can actually be run an investigated directly.

Otherwise, offhand, I can only mention that a ??? always only means one thing: the specifed column @foo does not exist in the data source for the glyph that is being hovered over. The data source for the glyph being hovered has to have all the named columns in its data dict. So the best first step is to print the keys of source.data and see if they are what you expect.

I am sorry for using wrong code formatting. I edited the format and added some of data to make the coding minimal reproducible as similar result that I got from my original work.

Also, I tried to print the keys of source.data, ans the column names I got were the same as I typed in my code. I suppose the incorrect point may be the CDS.

You are using @x and @y in the hover tool spec, but “x” and “y” are not the columns that exist in the CDS. You need to use the actual names of the columns in the CDS, which AFAICT are @{Process Pressure min} (used for the x-coordinate) and @{Process Pressure max} (used for the y-coordinate).

It works! I think the problem is I did not use the brackets becuase I tried to use both actual names and “x and y” before.

Thank you.

1 Like

FYI the syntax with the brackets around the name will always work, but it is required when the column name has spaces in it.

Good to know, thank you for telling me this point.

1 Like

This topic was automatically closed 90 days after the last reply. New replies are no longer allowed.