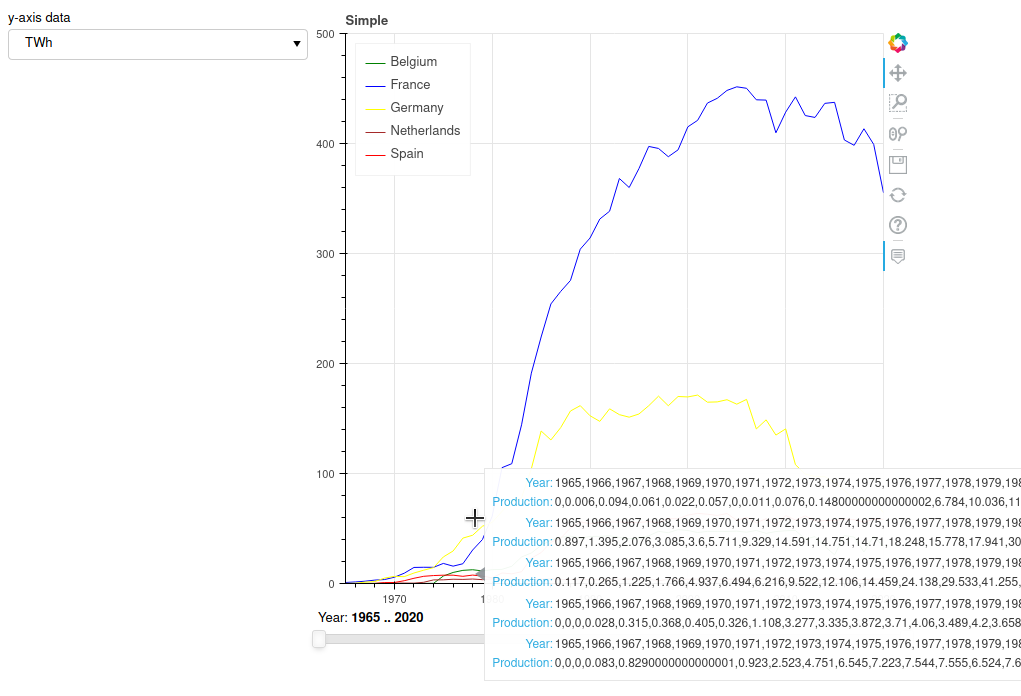
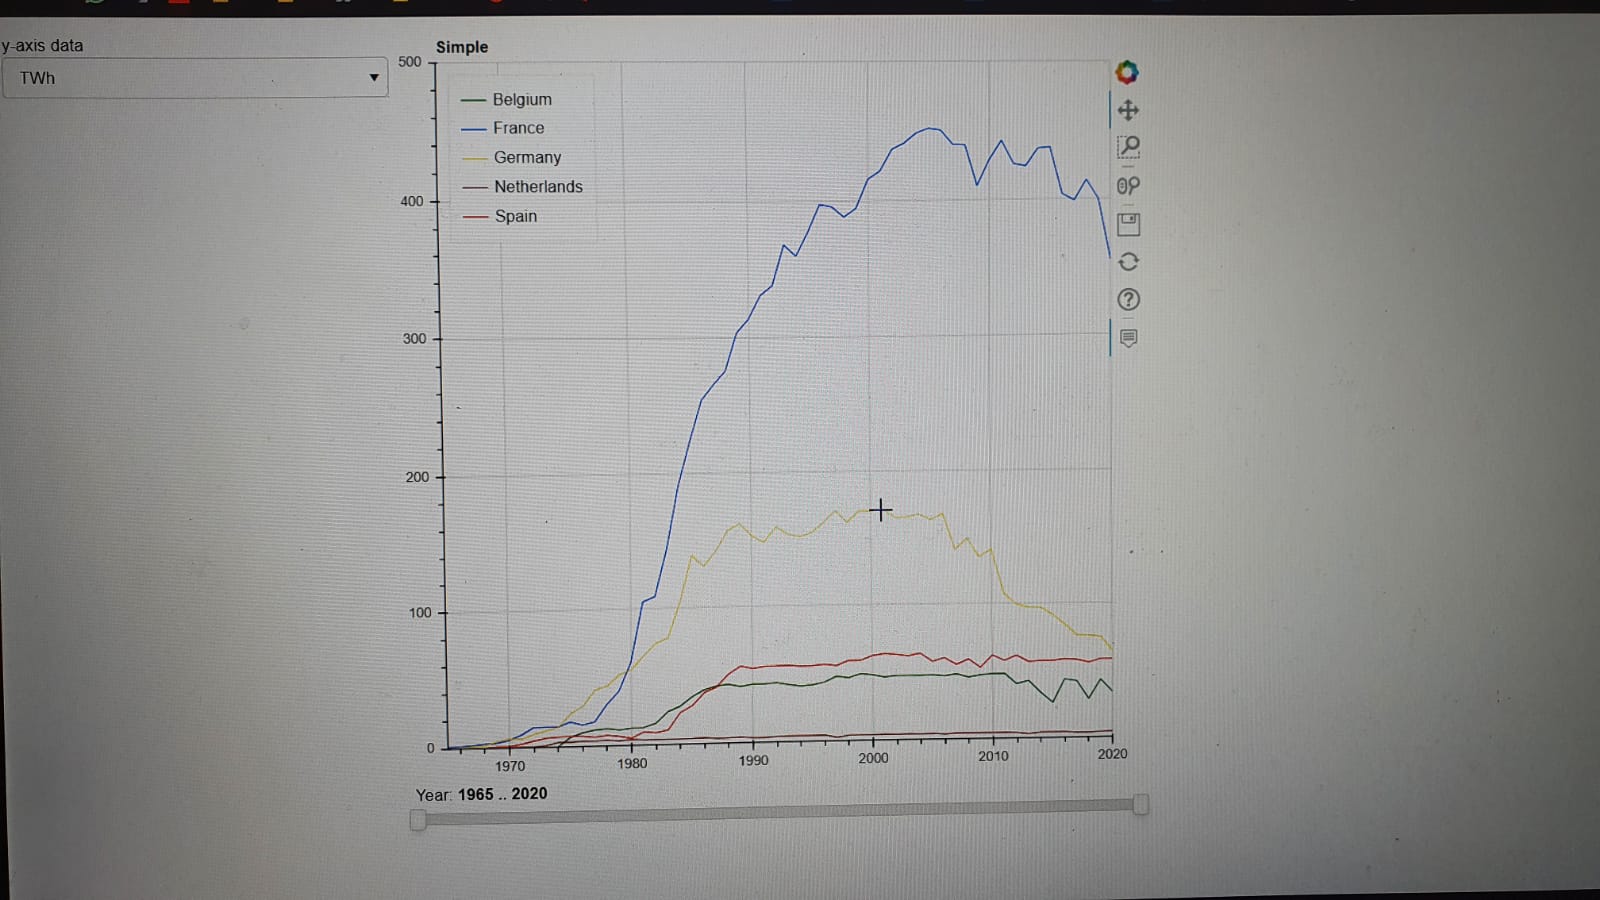
Hi, I’m just starting out with bokeh and I made a multi_line graph with year on the x-axis and production of energy on the y-axis. I’ve created an HoverTool to show the year and the production but when I run the plot, the hovertool is added but it does not show any data. It does not even show the box where the data should be shown, only the mouse indicator (see picture).
I have no clue what I am doing wrong, I’ve tried to change everything behind the @-sign but I keep getting the same issue. I also couldn’t find someone with the same issue since most people have problems with their data displaying incorrectly. If anybody knows what I am doing wrong and how to fix this, it would be much appreciated!
Data sources: Nuclear power generation - Our World in Data & https://ourworldindata.org/grapher/fossil-fuel-production?country=~OWID_WRL
from bokeh.io import show, output_file
from bokeh.plotting import figure, ColumnDataSource, curdoc
from bokeh.palettes import Spectral6
from bokeh.layouts import row, column
from bokeh.models import HoverTool, Select, RangeSlider
import pandas as pd
import numpy as np


#import datasets
df = pd.read_csv('nuclear-energy-generation.csv')
df_fossil_production = pd.read_csv('fossil-fuel-production.csv')
df = df.rename(columns={"Electricity from nuclear (TWh)": "TWh"})

#Filter for few countries for simplicity (temporary)
df = df.loc[df['Entity'].isin(["Netherlands",
                               'France',
                               'Belgium',
                               'Germany',
                               'Spain'])]
df_fossil_production = df_fossil_production.loc[df_fossil_production['Entity'].isin(["Netherlands",
                                                                                     'France',
                                                                                     'Belgium',
                                                                                     'Germany',
                                                                                     'Spain'])]

df_merge = pd.merge(df, df_fossil_production, on=["Entity", "Code", "Year"], how = 'outer')
df_merge['Oil'] = np.random.choice([111, 200, 15, 60, 300, 400, 266, 167, 566, 80, 69, 77, 277, 288, 199, 277, 310], df_merge.shape[0])

list1 = df_merge.transpose().values.tolist()

list2 = list1[2]
list3 = list2[:56]
Year = [list3, list3, list3, list3, list3]

#https://stackoverflow.com/questions/6614891/turning-a-list-into-nested-lists-in-python
list4 = list1[3]
i=0
TWh=[]
while i<len(list4):
  TWh.append(list4[i:i+56])
  i+=56

list5 = list1[7]
i=0
Oil=[]
while i<len(list5):
  Oil.append(list5[i:i+56])
  i+=56

legend = []
groups = df_merge.groupby('Entity')
for i, df_merge in groups:
    legend.append(i)

color = ['green', 'blue', 'yellow', 'brown', 'red']
source = ColumnDataSource(data= {
    'xs' : Year,
    "ys" : TWh,
    'color' : color,
    'legend' : legend})

xmin, xmax = min(df_merge.Year), max(df_merge.Year)
ymin, ymax = 0, 500

p = figure(title='Simple',
           x_range=(xmin, xmax),
           y_range=(ymin, ymax))

p.multi_line(xs = 'xs',
             ys = 'ys',
             line_color = 'color',
             legend = 'legend',
             source = source)

p.legend.location = 'top_left'

# Create a HoverTool: hover
hover = HoverTool(tooltips=[('Year', '@xs'),
                            ('Production', '@ys')], mode='vline')
# Add the hover tool to the figure p
p.add_tools(hover)

def callback (attr, old, new):
    y = select.value
    year_start, year_end = slider.value

    p.yaxis.axis_label = y
    #new_Year = list(range(year_start, year_en + 1))

    p.x_range.start = year_start
    p.x_range.end = year_end

    new_data = {
        'xs' : Year,
        'ys' : eval(y),
        'color' : color,
        'legend' : legend}
    source.data = new_data

select = Select(options=['TWh', 'Oil'], value='TWh', title='y-axis data')
slider = RangeSlider(start=1965, end=2020, value=(1965,2020), step=1, title="Year")
select.on_change('value', callback)
slider.on_change('value', callback)

layout = row(select, column(p, slider))
curdoc().add_root(layout)
output_file('line.html')
show(layout)