What are you trying to do?
Hello,
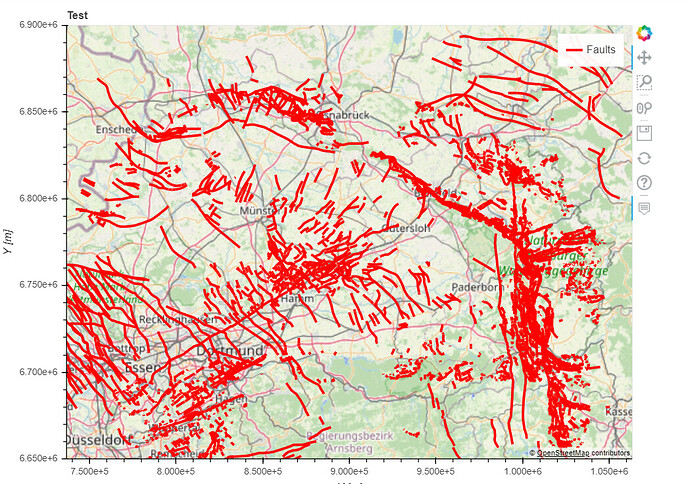
I am trying to plot a GeoDataFrame containing LineStrings representing geological lineaments (fault traces on the surface) and to create a HoverTool that shows me information such as the name of the fault or the length.
What have you tried that did NOT work as expected?
I achieved plotting the GeoDataFrame as multi_lines and created a HoverTool but when showing the plot. the information do not appear. The file is quite large, so there is a large number of lines. I recall that I read that a large number of lines may cause some issues with the Hover Tool? I also tried using @… in the tooltips but not even a frame appears…
Thanks for the help 
Here some code examples:
from bokeh.models import ColumnDataSource
geo_data = ColumnDataSource(faults_reproj.drop('geometry', axis=1))

p = figure(title="Test",
           x_axis_label='X [m]',
           y_axis_label='Y [m]',
           match_aspect=True,
           plot_width=800,
           plot_height=600,
           x_range=(7.5e5, 10.5e5),
           y_range=(6.65e6, 6.90e6))

p.add_tile(tile_provider)

faults_renderer = p.multi_line(xs='X',
                               ys='Y',
                               source=geo_data,
                               color='red',
                               line_width=3,
                               legend_label="Faults",
                               hover_line_alpha=1.0)

fault_hover_tool = HoverTool(tooltips=[('X_value', '$xs')],
                             renderers=[faults_renderer],
                             line_policy='nearest',
                             show_arrow=False,
                             mode='vline'
    )

p.add_tools(fault_hover_tool)
p.legend.click_policy="hide"
show(p)
