Hi,
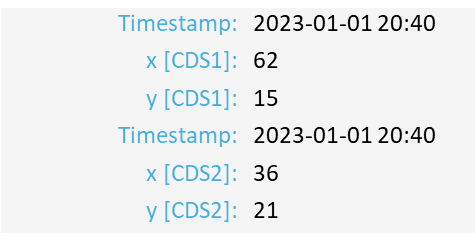
I have two CDS, each CDS has columns “Timestamp”, “x” and “y”. The default hover tool shows the following tooltip.
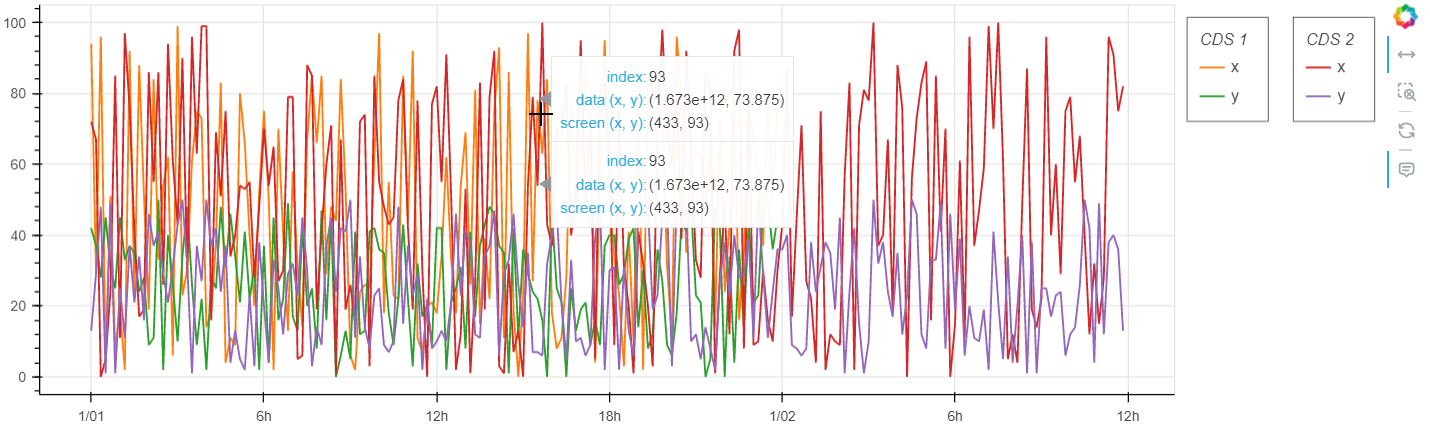
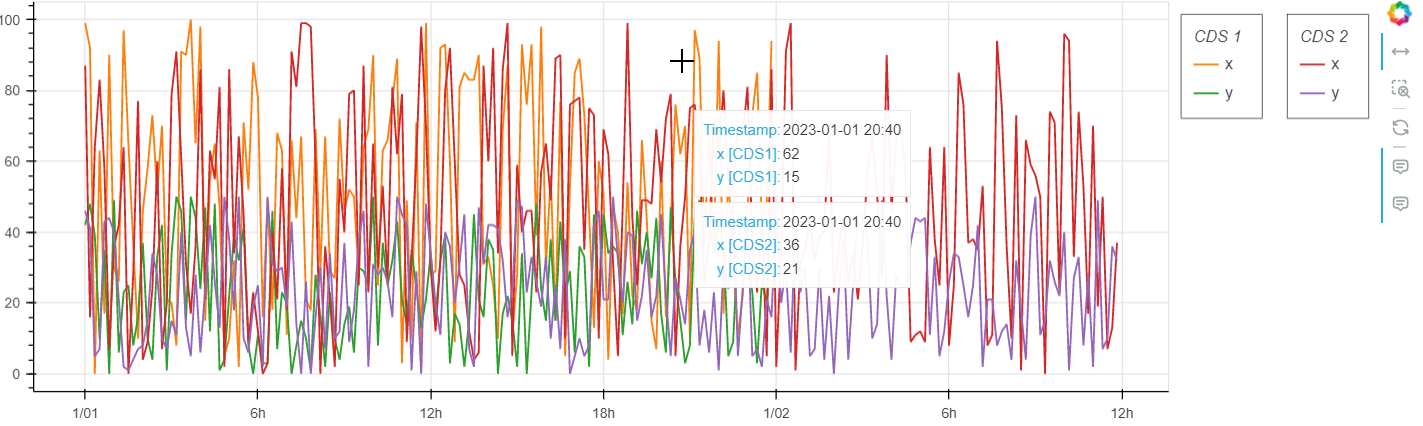
However, I want to show a single tooltip that has “Timestamp [CDS1]”, “x [CDS1]”, “y [CDS1]”, “Timestamp [CDS2]”, “x [CDS2]”, “y [CDS2]”. I managed to get this but I had to introduce two hover tools that show two tooltips and each has to be activated separately (see figure below).
MRE is as follows.
import pandas as pd
import random

from bokeh.plotting import figure
from bokeh.palettes import Category10
from bokeh.models import (ColumnDataSource, Legend, HoverTool, LegendItem)
from bokeh.io import show

# =============================================================================
# Function to create a dummy dataframe of given size
# =============================================================================
def dummy_df(size):
    df = pd.DataFrame(zip([random.randint(0, 100) for i in range(size)],
                          [random.randint(0, 50) for i in range(size)]),
                      columns=['x', 'y'],
                      index=pd.date_range("01-01-2023 00:00:00", periods=size,
                                          freq="10T"))
    df.index.name = 'Timestamp'
    return df

# Creating two CDS from two different dummy dataframes
cds1 = ColumnDataSource(dummy_df(size=144)) #CDS1
cds2 = ColumnDataSource(dummy_df(size=216)) #CDS2

# Bokeh palette/colors
color=Category10[10]

# Bokeh Tools
tools=['xpan', 'xbox_zoom', 'reset']

# Creating figure
p = figure(x_axis_type='datetime', width=1140, height=342, tools=tools,
           toolbar_location="right")

# Creating glyphs of all columns of CDS1 except Timestamp
for j,i in enumerate(cds1.data.keys()):
    if i not in ["Timestamp"]:
        p.line(x="Timestamp", y=i, width=1.5, source=cds1, color=color[j])

# Creating glyphs of all columns of CDS2 except Timestamp
for j,i in enumerate(cds2.data.keys()):
    if i not in ["Timestamp"]:
        p.line(x="Timestamp", y=i, width=1.5, source=cds2, color=color[j+2])

# =============================================================================
# Making legend box of each CDS's columns/labels to the right side of the figure
# =============================================================================

# Making list of columns of CDS1 except Timestamp
columns_cds1 = [i for i in cds1.data.keys() if i!="Timestamp"]

# Making list of legend items for respective glyphs from list of CDS1's columns
leg_items_cds1 = [LegendItem(label=j, renderers=[p.renderers[i]], index=i)
                  for i,j in enumerate(columns_cds1)]

# CDS1 legend items layout for figure
leg_cds1_layout = Legend(items=leg_items_cds1, location="top_center",
                         orientation="vertical", border_line_color="black",
                         title="CDS 1")
p.add_layout(leg_cds1_layout, 'right')

# Making list of columns of CDS2 except Timestamp
columns_cds2 = [i for i in cds2.data.keys() if i!="Timestamp"]

# Making list of legend items for respective glyphs from list of CDS2's columns
leg_items_cds2 = [LegendItem(label=j, renderers=[p.renderers[i+len(columns_cds1)]],
                             index=i) for i,j in enumerate(columns_cds2)]

# CDS2 legend items layout
leg_cds2_layout = Legend(items=leg_items_cds2, location="top_center",
                         orientation="vertical", border_line_color="black",
                         title="CDS 2")
p.add_layout(leg_cds2_layout, 'right')

# On-click policy for legends
p.legend.click_policy="hide"

# =============================================================================
# Hovetool
# =============================================================================

# Tooltips for CDS1
ttips1 = [(f'{i} [CDS1]', f'@{i}') for i in columns_cds1]
ttips1.insert(0, ('Timestamp', '@Timestamp{%Y-%m-%d %H:%M}'))

# Tooltips for CDS1
ttips2 = [(f'{i} [CDS2]', f'@{i}') for i in columns_cds2]
ttips2.insert(0, ('Timestamp', '@Timestamp{%Y-%m-%d %H:%M}'))

# Timestamp (datetime column) formatting
formatters={'@Timestamp': 'datetime'}

# Hover tool for CDS1 (hovertool#1)
htool1 = HoverTool(renderers=[p.renderers[0]], tooltips=ttips1,
                    mode='vline', show_arrow = False,
                    formatters=formatters)

# Hover tool for CDS2 (hovertool#2)
htool2 = HoverTool(renderers=[p.renderers[len(columns_cds1)]],
                    tooltips=ttips2,
                    mode='vline', show_arrow = False,
                    formatters=formatters)


p.add_tools(htool1, htool2)
p.toolbar.active_inspect = None


show(p)
There are three problems with it:
1) When the glyphs coincide at some timestamp then one hover tooltip hides behind the other (see figure below).
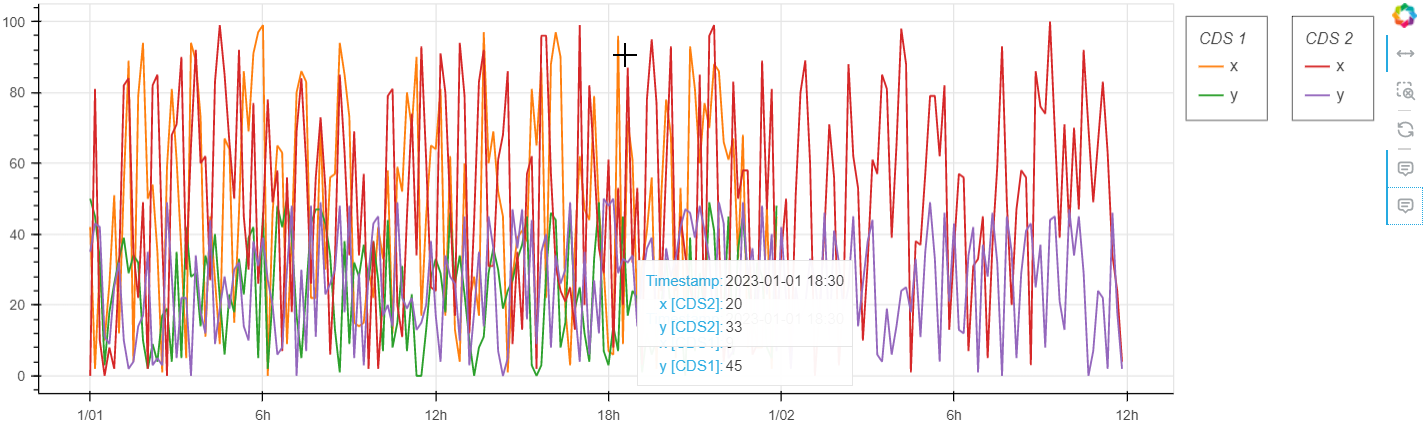
2) As I picked the p.renderers[0] (column “x” of CDS1’s glyph) for hovertool#1 to show tooltip,
htool1 = HoverTool(renderers=[p.renderers[0]], tooltips=ttips1, mode='vline', show_arrow = False, formatters=formatters)
so now when the p.renderers[0] is made hidden with click policy or if the data at any timestamp for it is missing, the tooltip doesn’t appear at all for the CDS1 (see figure below, where CDS1’s “x” is made hidden).
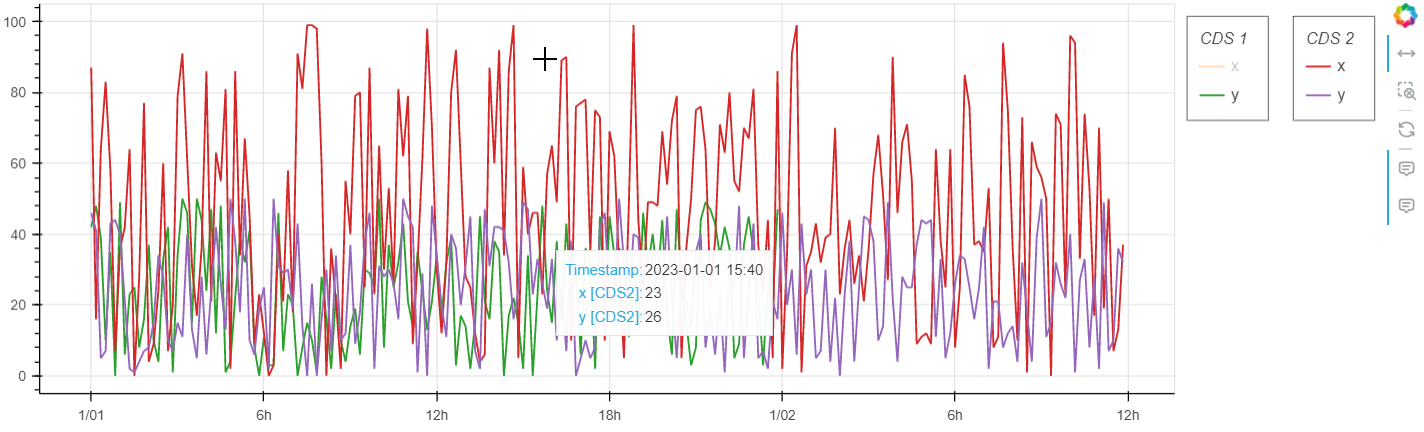
3) Same is the case with hovertool#2 and its respective renderer (see figure below).
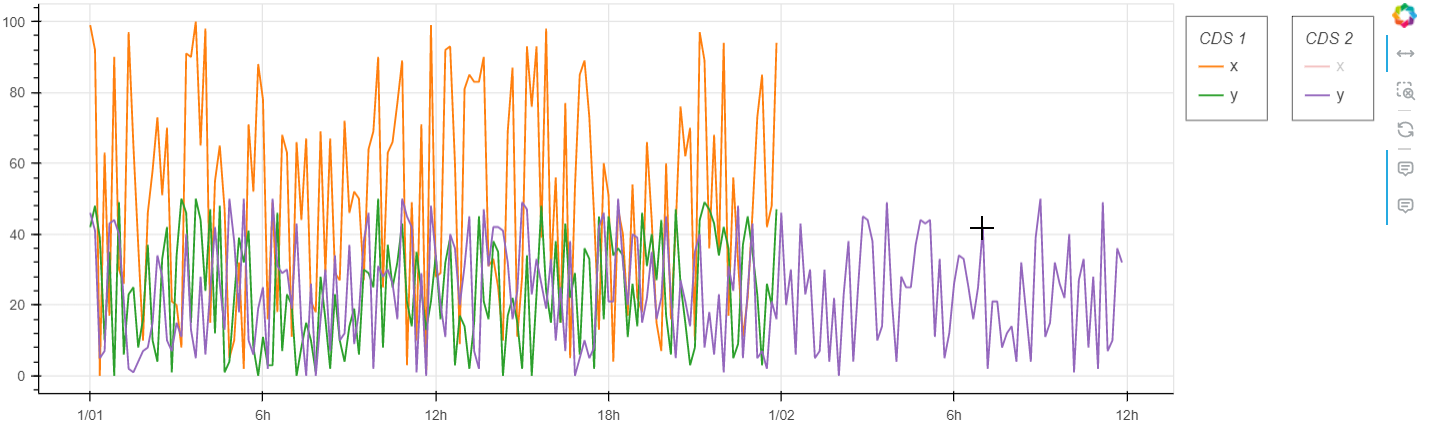
The solution I am looking for is to just have one hover tool showing only one tooltip keeping two CDS (something like the figure below).
Thank you.