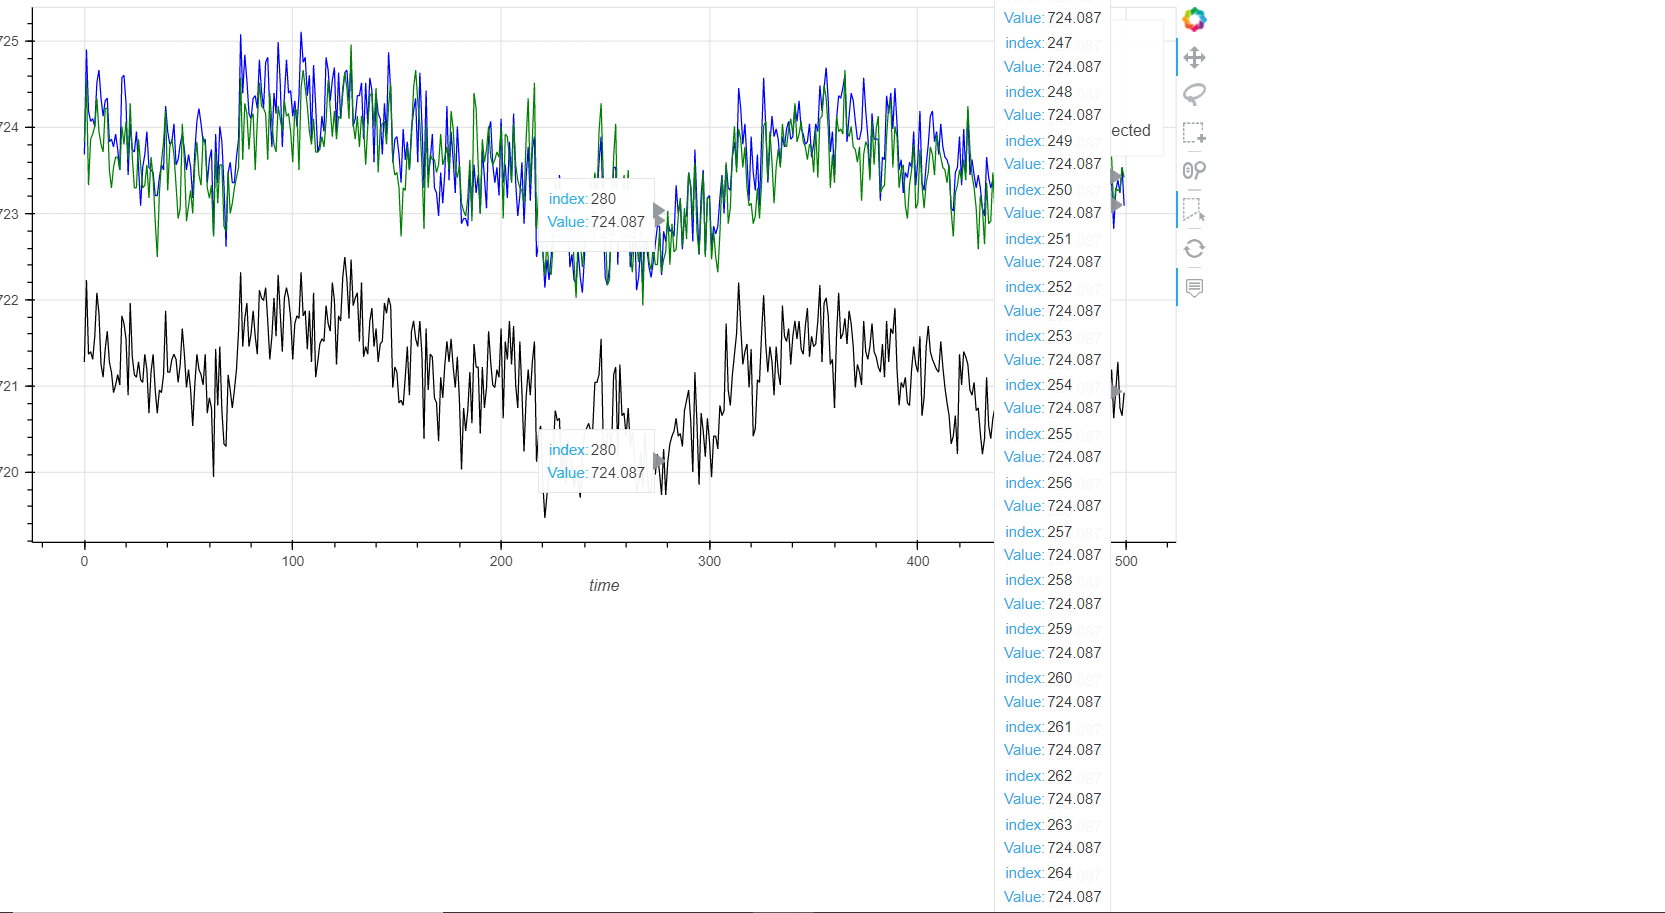
I think I found what cause to that thing. In my code, when I close the “scatter_render” section HoverTool works properly but then I cannot use my selection tool on my graph. Is it a bug inside of the library or that causes because of my coding style?
import read_val as rv
import pandas as pd
from bokeh.plotting import figure,show,gridplot,output_file
from bokeh.models import ColumnDataSource,CustomJS, HoverTool


def plot1 (Value1, Value2, Value3):

        dataset1       = pd.DataFrame(data={'time1':range(len(Value1)),'data1':Value1})
        dataset2       = pd.DataFrame(data={'time2':range(len(Value2)),'data2':Value2})
        dataset3       = pd.DataFrame(data={'time3':range(len(Value3)),'data3':Value3})

        s1          = ColumnDataSource(data=dataset1)
        s2          = ColumnDataSource(data=dataset2)
        s3          = ColumnDataSource(data=dataset3)

        TOOLS       ="pan,wheel_zoom,reset,poly_select,xbox_select,lasso_select"

        p1          = figure(title = 'Plot1' ,x_axis_label = 'time'
                         , y_axis_label='Voltage (V)',plot_width=1000, plot_height=300,tools=TOOLS)

        p2          = figure(title = 'Plot2' ,x_axis_label = 'time'
                         , y_axis_label='Voltage (V)',plot_width=1000, plot_height=300,tools=TOOLS)

        p3          = figure(title = 'Plot3' ,x_axis_label = 'time'
                       , y_axis_label='Voltage (V)',plot_width=1000, plot_height=300,tools=TOOLS)

        p1.add_tools(HoverTool(
            tooltips = [
                ( 'index', '$index'),
                ( 'Value', '@data1'),
            ],

        formatters={
                'Index'      : 'numeral',         # use 'datetime' formatter for 'date' field
                'Value'      : 'numeral',         # use default 'numeral' formatter for other fields
        },

        mode='vline'
        ))


        line_rend1 = p1.line('time1', 'data1', color="black",legend_label="V1", line_width=1,source=s1)
        line_rend1.selection_glyph = line_rend1.glyph
        line_rend1.nonselection_glyph = line_rend1.glyph

        line_rend2 = p2.line('time2', 'data2',color="blue", legend_label="V2", line_width=1,source=s2)
        line_rend2.selection_glyph = line_rend2.glyph
        line_rend2.nonselection_glyph = line_rend2.glyph

        line_rend3 = p3.line('time3', 'data3', color="green",legend_label="V3", line_width=1,source=s3)
        line_rend3.selection_glyph = line_rend3.glyph
        line_rend3.nonselection_glyph = line_rend3.glyph

        """

        scatter_rend1 = p1.scatter('time1','data1',fill_alpha=0,source=s1,line_alpha=0)
        scatter_rend1.selection_glyph = scatter_rend1.glyph
        scatter_rend1.nonselection_glyph = scatter_rend1.glyph

        scatter_rend2 = p2.scatter('time2','data2',fill_alpha=0,source=s2,line_alpha=0)
        scatter_rend2.selection_glyph = scatter_rend2.glyph
        scatter_rend2.nonselection_glyph = scatter_rend2.glyph

        scatter_rend3 = p3.scatter('time3','data3',fill_alpha=0,source=s3,line_alpha=0)
        scatter_rend3.selection_glyph = scatter_rend3.glyph
        scatter_rend3.nonselection_glyph = scatter_rend3.glyph

        """

        sel_src1 = ColumnDataSource(data={'time1':[],'data1':[]})
        sel_line_render1 = p1.line('time1','data1',legend_label='Selected',line_color='orange',source=sel_src1)

        sel_src2 = ColumnDataSource(data={'time2':[],'data2':[]})
        sel_line_render2 = p2.line('time2','data2',legend_label='Selected',line_color='orange',source=sel_src2)

        sel_src3 = ColumnDataSource(data={'time3':[],'data3':[]})
        sel_line_render3 = p3.line('time3','data3',legend_label='Selected',line_color='orange',source=sel_src3)

        cb1=CustomJS(args=dict(s1=s1,sel_src=sel_src1)
                ,code='''
                var sel_inds = s1.selected.indices
                var sel_time = []
                var sel_data = []
                for (var i=0;i<s1.selected.indices.length;i++){
                        sel_time.push(s1.data['time1'][sel_inds[i]])
                        sel_data.push(s1.data['data1'][sel_inds[i]])}
                console.log('Min Selection of V1:')
                console.log(Math.min(...sel_data))
                console.log('Max Selection of V1:')
                console.log(Math.max(...sel_data))
                sel_src.data['time1']= sel_time
                sel_src.data['data1'] = sel_data
                sel_src.change.emit()
                ''')
        s1.selected.js_on_change('indices',cb1)

        cb2=CustomJS(args=dict(s2=s2,sel_src=sel_src2)
                ,code='''
                var sel_inds = s2.selected.indices
                var sel_time = []
                var sel_data = []
                for (var i=0;i<s2.selected.indices.length;i++){
                        sel_time.push(s2.data['time2'][sel_inds[i]])
                        sel_data.push(s2.data['data2'][sel_inds[i]])}
                console.log('Min Selection of V2:')
                console.log(Math.min(...sel_data))
                console.log('Max Selection of V2:')
                console.log(Math.max(...sel_data))
                sel_src.data['time2']= sel_time
                sel_src.data['data2'] = sel_data
                sel_src.change.emit()
                ''')
        s2.selected.js_on_change('indices',cb2)

        cb3=CustomJS(args=dict(s3=s3,sel_src=sel_src3)
            ,code='''
            var sel_inds = s3.selected.indices
            var sel_time = []
            var sel_data = []
            for (var i=0;i<s3.selected.indices.length;i++){
                    sel_time.push(s3.data['time3'][sel_inds[i]])
                    sel_data.push(s3.data['data3'][sel_inds[i]])}
            console.log('Min Selection of V3:')
            console.log(Math.min(...sel_data))
            console.log('Max Selection of V3:')
            console.log(Math.max(...sel_data))
            sel_src.data['time3']= sel_time
            sel_src.data['data3'] = sel_data
            sel_src.change.emit()
            ''')
        s3.selected.js_on_change('indices',cb3)

        #grid = gridplot([[p1, p2], [None, p3]])


        output_file("MultiplePlottingTest.html")

        grid = gridplot([[p1],[p2],[p3]])
        show(grid)