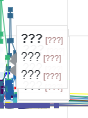
When I hover over all functions on the plot, the ones which have question marks I dont want it to show anything on them. How can I tell it to only show for a specific function in the plot and not all of them.
"???" signals that the hover tool is attempting to access a column in a ColumnDataSource that does not exist. It's impossible to say anything more specific about your particular case without real code to examine.
When I hover over all functions on the plot, the ones which have question marks I dont want it to show anything on them. How can I tell it to only show for a specific function in the plot and not all of them.
trace_plot1.scatter(‘Date’, y = 0.11, size = 20, line_color=“navy”, fill_color=“orange”, alpha=0.5,
source = source, marker = “inverted_triangle”)
trace_plot1.tools.append(hover)
scriptTrace, divTrace = components(trace_plot1)
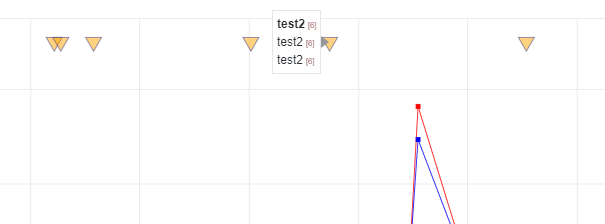
trace_plot1 is the blue and red curves in the plot.
The hovertool is the inverted triangles.
I only want it to show on the inverted triangles. Which it is doing here:
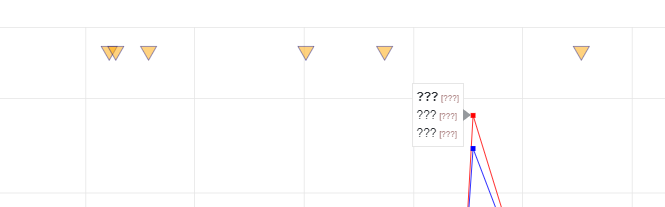
And not on the trace_plot1 like its doing here with the question marks when I hover over:
Is there a way to have the hovertool only show on specific functions and not all in the plot?
···
On Thursday, October 11, 2018 at 12:58:37 PM UTC+2, Zana wrote:
Hi,
I have added the Hovertool as following:
hover = HoverTool()
hover.tooltips = “”"
@Event
[@ID]
@Description
[@ID]
@Reason
[@ID]
“”"
When I hover over all functions on the plot, the ones which have question marks I dont want it to show anything on them. How can I tell it to only show for a specific function in the plot and not all of them.
Or I could have a hover tool on the trace_plot but maybe it can show date and value of data points. Because the trace_plot data does not have Event, Description and Reason in its data source.
···
On Thursday, October 11, 2018 at 12:58:37 PM UTC+2, Zana wrote:
Hi,
I have added the Hovertool as following:
hover = HoverTool()
hover.tooltips = “”"
@Event
[@ID]
@Description
[@ID]
@Reason
[@ID]
“”"
When I hover over all functions on the plot, the ones which have question marks I dont want it to show anything on them. How can I tell it to only show for a specific function in the plot and not all of them.