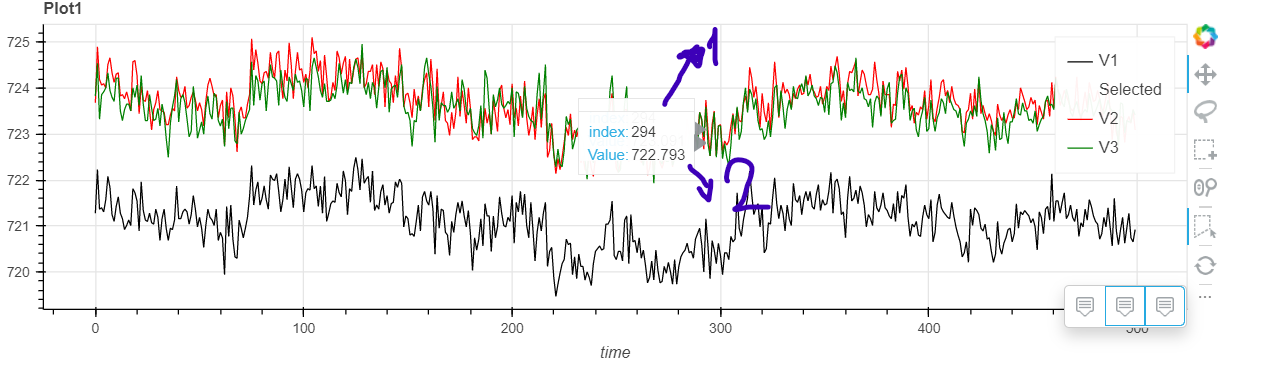
I am using HoverTool for seeing the values on the graph which contains multiple lines in the one figure but some of the line graph values are so close to each other and when I activate the Hover the values are overlaps. is there any solution to solve this problem ?
If they are individual Line glyphs, you could look at the “attachment” or potentially the “anchor” properties of the hovertools.
I added properties that you mentioned to my code like shown below but still boxes are overlaps.
 p.add_tools(HoverTool(renderers = [line_rend1], anchor = "bottom_right", attachment = 'vertical',


        tooltips = [

            ( 'index', '$index'),
            ( 'Value', '@data1'),

        ],

    formatters={

            'Index'      : 'numeral',         # use 'datetime' formatter for 'date' field
            'Value'      : 'numeral',         # use default 'numeral' formatter for other fields
    },

    mode= 'vline'

))```This topic was automatically closed 90 days after the last reply. New replies are no longer allowed.