In Jupyter using Bokeh, I need the x_range of p . However, after dragging, the x_range does not update and remains at its initial value. Why is this happening? Below is my code and a screenshot. I used a simple example to demonstrate the issue. After dragging, the print in the subsequent cell still shows the initial values.
import numpy as np
from bokeh.layouts import column
from bokeh.models import ColumnDataSource, RangeTool
from bokeh.plotting import figure, show
x = np.linspace(0, 10, 500)
y = np.sin(x)
source = ColumnDataSource(data=dict(x=x, y=y))
p = figure(height=300, width=800, tools="xpan", toolbar_location=None,
x_axis_type="datetime", x_axis_location="above",
background_fill_color="#efefef", x_range=(x[15], x[25]))
p.line('x', 'y', source=source)
p.yaxis.axis_label = 'Price'
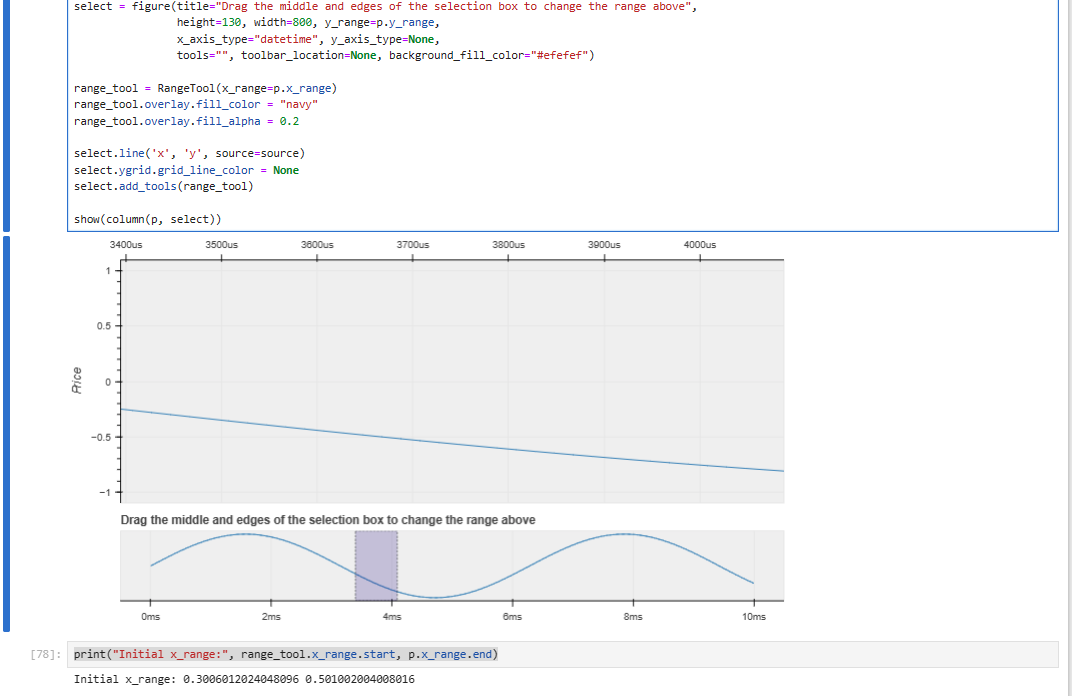
select = figure(title="Drag the middle and edges of the selection box to change the range above",
height=130, width=800, y_range=p.y_range,
x_axis_type="datetime", y_axis_type=None,
tools="", toolbar_location=None, background_fill_color="#efefef")
range_tool = RangeTool(x_range=p.x_range)
range_tool.overlay.fill_color = "navy"
range_tool.overlay.fill_alpha = 0.2
select.line('x', 'y', source=source)
select.ygrid.grid_line_color = None
select.add_tools(range_tool)
show(column(p, select))
print("Initial x_range:", range_tool.x_range.start, p.x_range.end)