My solution for live stock price plotting:
On the start page the user can add a Plot for each stock by selecting it from a list.
Multiplot class has:
-
self.div = Div(text = “”, width = 1200, height = 0) where all plots are added
-
Dropdown with stock list (to select by the user)
-
Plot list for holding added plots = Plot objects, instantiated with: plot = Plot(params)
-
Add plot method:
rootLayout = curdoc().get_model_by_name(self.plot_container)
listOfSubLayouts = rootLayout.children
listOfSubLayouts.append(plot.get_figure())
-
init method with:
mainLayout = column(row(self.div, name = “Multiple Plots Container”))
curdoc().add_root(mainLayout)
curdoc().add_periodic_callback(self.update, 1000)
session = push_session(curdoc())
session.show()
session.loop_until_closed()
-
update method with:
for iter in self.plots:
self.plots[iter].update(stock_data)
Plot class has:
-
self.plot_main = Figure()
-
source_lines = ColumnDataSource(data_source_dict)
-
self.lines = self.plot_main.line(params, source = self.source_lines)
-
update method with self.source_lines.stream(new_source_data)
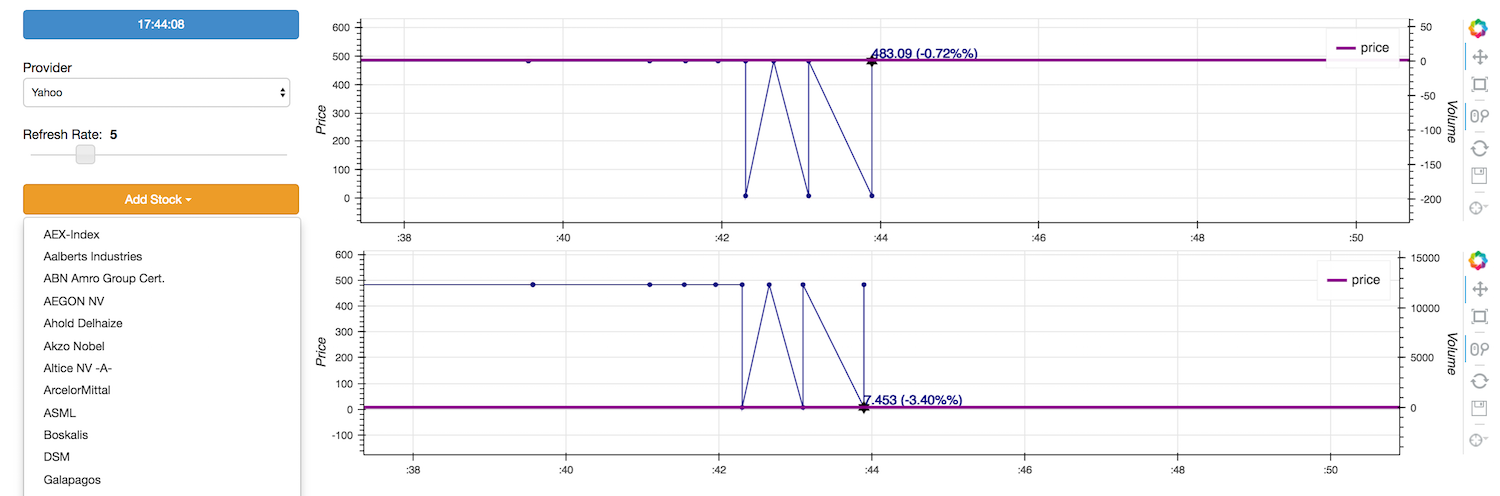
What I am getting are two identical plots (see attached image) with a saw pattern. The points (bullets) match the data. The problem is that the points are not being connected with each other with lines but always go to point 0 there between
Any clue what I am doing wrong?

Hi Bryan,
I think I made my question too complicated because no one answers…
I noticed that the plot data is being mixed when having 2 live-plots on the same page and when using stream method to one bokeh server.
Could you confirm that one bokeh server can handle only one live-plot?
Or how many live-plots can a single bokeh server handle?
With one plot all works fine. When I add another plot the drawing looks liek in the screenshot above.
Thanks.
···
On Thursday, January 12, 2017 at 10:10:36 PM UTC+1, [email protected] wrote:
My solution for live stock price plotting:
- start page based on MultiPlot class (see below)
On the start page the user can add a Plot for each stock by selecting it from a list.
Multiplot class has:
- self.div = Div(text = “”, width = 1200, height = 0) where all plots are added
- Dropdown with stock list (to select by the user)
- Plot list for holding added plots = Plot objects, instantiated with: plot = Plot(params)
rootLayout = curdoc().get_model_by_name(self.plot_container)
listOfSubLayouts = rootLayout.children
listOfSubLayouts.append(plot.get_figure())
mainLayout = column(row(self.div, name = “Multiple Plots Container”))
curdoc().add_root(mainLayout)
curdoc().add_periodic_callback(self.update, 1000)
session = push_session(curdoc())
session.show()
session.loop_until_closed()
for iter in self.plots:
self.plots[iter].update(stock_data)
Plot class has:
- self.plot_main = Figure()
- source_lines = ColumnDataSource(data_source_dict)
- self.lines = self.plot_main.line(params, source = self.source_lines)
- update method with self.source_lines.stream(new_source_data)
What I am getting are two identical plots (see attached image) with a saw pattern. The points (bullets) match the data. The problem is that the points are not being connected with each other with lines but always go to point 0 there between
Any clue what I am doing wrong?
I managed to get it work properly by having a unique name for the data_source dictionary per plot
exec(“self.source_” + data[‘name’] + " = ColumnDataSource({‘time’: , ‘price’: })")
self.plot_main = figure(title = data[‘name’], x_axis_type = “datetime”)
self.lines = self.plot_main.line(x = ‘time’, y = ‘price’, source = eval(“self.source_” + data[‘name’]))
``
···
On Thursday, January 12, 2017 at 10:10:36 PM UTC+1, Tony Halik wrote:
My solution for live stock price plotting:
- start page based on MultiPlot class (see below)
On the start page the user can add a Plot for each stock by selecting it from a list.
Multiplot class has:
- self.div = Div(text = “”, width = 1200, height = 0) where all plots are added
- Dropdown with stock list (to select by the user)
- Plot list for holding added plots = Plot objects, instantiated with: plot = Plot(params)
rootLayout = curdoc().get_model_by_name(self.plot_container)
listOfSubLayouts = rootLayout.children
listOfSubLayouts.append(plot.get_figure())
mainLayout = column(row(self.div, name = “Multiple Plots Container”))
curdoc().add_root(mainLayout)
curdoc().add_periodic_callback(self.update, 1000)
session = push_session(curdoc())
session.show()
session.loop_until_closed()
for iter in self.plots:
self.plots[iter].update(stock_data)
Plot class has:
- self.plot_main = Figure()
- source_lines = ColumnDataSource(data_source_dict)
- self.lines = self.plot_main.line(params, source = self.source_lines)
- update method with self.source_lines.stream(new_source_data)
What I am getting are two identical plots (see attached image) with a saw pattern. The points (bullets) match the data. The problem is that the points are not being connected with each other with lines but always go to point 0 there between
Any clue what I am doing wrong?