How can I make legend outside plot area with stacked bar

0down votefavorite

Hello,
I have a problem with Bokeh library. I need make a legend box outside plot area. It works for circle and area plotting. I can’t find the solution for the stacked bar.With the solution below the legend shapes one part of the graph, it isn’t acceptable (see link under the code).I would like a legend in the box.

Regards, SR


import numpy as np
from bokeh.layouts import gridplot
from bokeh.models import ColumnDataSource, NumeralTickFormatter,LinearAxis, Range1d, Legend
from bokeh.plotting import show, output_notebook, figure from bokeh.core.properties import value
from math import pi
output_notebook()
colors=['#47A440','#9FCDC8']
source = ColumnDataSource(F)
mois=F.mois.tolist()
def insert(colonne, position1, position2,valeur1, valeur2):
li=[]
li=colonne.tolist()
li.insert(position1,valeur1)
li.insert(position2, valeur2)
return li
Data_mois_area= insert(F.mois,0,12,'Janvier','Décembre')
Data_conso_area= insert(F.Pui_Conso,0,13,0,0)
Data_pv_area= insert(F.Pui_PV,0,13,0,0)
p = figure(x_range=mois, plot_height=500, plot_width=800,toolbar_location=None,tools="hover")
xa=range(len(F.mois))
r0=p.patch(x=Data_mois_area, y=Data_conso_area, color="#003BFB")
r1=p.patch(x=Data_mois_area, y=Data_pv_area, color="#FBB000")
p.vbar_stack(['Pui_Autocon','Pui_Réinj'], x='mois', width=0.5, color=colors,line_width=1, line_color='black',
legend=['Autoconsommation','Réinjection'], source=source)
r3=p.circle(x='mois', y='Taux_autocon', size=10, color="red", y_range_name="foo", source=source )
r4=p.circle(x='mois', y='Taux_autopro', size=10, color="purple", y_range_name="foo", source=source)
p.y_range.start = 0
p.x_range.range_padding = 0.1
p.xgrid.grid_line_color = None
p.axis.minor_tick_line_color = None
p.outline_line_color = None
p.title.text = "Besoins et Consommation"
p.title.align = "center"
p.title.text_color = "black"
p.title.text_font_size = "15px"
p.xaxis.major_label_orientation = pi/4
p.yaxis.major_label_orientation = "horizontal"
p.yaxis.axis_label = "Energie en kWh"
p.yaxis.axis_label_text_font_style = "italic"
p.extra_y_ranges['foo'] = Range1d(0, 1.02)
p.add_layout(LinearAxis(y_range_name="foo"), 'right')
p.legend.orientation = "horizontal"
legend = Legend(items=[
("Consommation", [r0]),
("Production", [r1]),
("Taux autoconsommation", [r3]),
("Taux autoproduction ",[r4]), ], location=(1, -30))
p.add_layout(legend, 'right')}
show(p

``
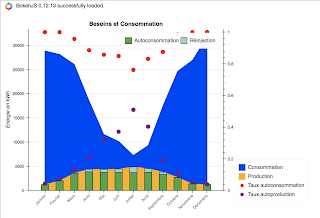
I think you came across the solution but for the sake of anyone else: for now you'll need to use bokeh.transform.stack explicitly yourself. It might be reasonable and simple for vbar_stack, etc to return a list of the renderers it creates. Then you could just add those directly to a legend you create. Feel free to make a GH issue to request this feature.

Thanks,

Bryan

···

On Jan 15, 2018, at 10:37, [email protected] wrote:

0
down vote
favorite
Hello,
I have a problem with Bokeh library. I need make a legend box outside plot area. It works for circle and area plotting. I can't find the solution for the stacked bar.With the solution below the legend shapes one part of the graph, it isn't acceptable (see link under the code).I would like a legend in the box.

Regards, SR

import numpy as np
from bokeh.layouts import gridplot
from bokeh.models import ColumnDataSource,
NumeralTickFormatter,LinearAxis, Range1d, Legend
from bokeh.plotting import show, output_notebook, figure
from bokeh.core.properties import value
from math import pi
output_notebook()
colors=['#47A440','#9FCDC8']
source = ColumnDataSource(F)
mois=F.mois.tolist()

def insert(colonne, position1, position2,valeur1, valeur2):
    li=
    li=colonne.tolist()
    li.insert(position1,valeur1)
    li.insert(position2, valeur2)
    return li
Data_mois_area= insert(F.mois,0,12,'Janvier','Décembre')
Data_conso_area= insert(F.Pui_Conso,0,13,0,0)
Data_pv_area= insert(F.Pui_PV,0,13,0,0)
p = figure(x_range=mois, plot_height=500,
plot_width=800,toolbar_location=None,tools="hover")
xa=range(len(F.mois))
r0=p.patch(x=Data_mois_area, y=Data_conso_area, color="#003BFB")
r1=p.patch(x=Data_mois_area, y=Data_pv_area, color="#FBB000")
p.vbar_stack(['Pui_Autocon','Pui_Réinj'], x='mois', width=0.5,
color=colors,line_width=1, line_color='black',
         legend=['Autoconsommation','Réinjection'], source=source)
r3=p.circle(x='mois', y='Taux_autocon', size=10, color="red",
y_range_name="foo", source=source )
r4=p.circle(x='mois', y='Taux_autopro', size=10, color="purple",
y_range_name="foo", source=source)
p.y_range.start = 0
p.x_range.range_padding = 0.1
p.xgrid.grid_line_color = None
p.axis.minor_tick_line_color = None
p.outline_line_color = None
p.title.text = "Besoins et Consommation"
p.title.align = "center"
p.title.text_color = "black"
p.title.text_font_size = "15px"
p.xaxis.major_label_orientation = pi/4
p.yaxis.major_label_orientation = "horizontal"
p.yaxis.axis_label = "Energie en kWh"
p.yaxis.axis_label_text_font_style = "italic"
p.extra_y_ranges['foo'] = Range1d(0, 1.02)
p.add_layout(LinearAxis(y_range_name="foo"), 'right')
p.legend.orientation = "horizontal"
legend = Legend(items=[
("Consommation", [r0]),
("Production", [r1]),
("Taux autoconsommation", [r3]),
("Taux autoproduction ",[r4]),
], location=(1, -30))
p.add_layout(legend, 'right')}
show(p

--
You received this message because you are subscribed to the Google Groups "Bokeh Discussion - Public" group.
To unsubscribe from this group and stop receiving emails from it, send an email to [email protected].
To post to this group, send email to [email protected].
To view this discussion on the web visit https://groups.google.com/a/continuum.io/d/msgid/bokeh/747c1a9a-022d-4ad3-b639-7e762a0bf4fd%40continuum.io\.
For more options, visit https://groups.google.com/a/continuum.io/d/optout\.

Hello Bryan,
I solved the problem, I used bokeh.transform.stack as you message.
Thank you !

···

Le 16 janv. 2018 à 22:15, Bryan Van de ven <[email protected]> a écrit :

I think you came across the solution but for the sake of anyone else: for now you'll need to use bokeh.transform.stack explicitly yourself. It might be reasonable and simple for vbar_stack, etc to return a list of the renderers it creates. Then you could just add those directly to a legend you create. Feel free to make a GH issue to request this feature.

Thanks,

Bryan

On Jan 15, 2018, at 10:37, [email protected] wrote:

0
down vote
favorite
Hello,
I have a problem with Bokeh library. I need make a legend box outside plot area. It works for circle and area plotting. I can't find the solution for the stacked bar.With the solution below the legend shapes one part of the graph, it isn't acceptable (see link under the code).I would like a legend in the box.

Regards, SR

import numpy as np
from bokeh.layouts import gridplot
from bokeh.models import ColumnDataSource,
NumeralTickFormatter,LinearAxis, Range1d, Legend
from bokeh.plotting import show, output_notebook, figure
from bokeh.core.properties import value
from math import pi
output_notebook()
colors=['#47A440','#9FCDC8']
source = ColumnDataSource(F)
mois=F.mois.tolist()

def insert(colonne, position1, position2,valeur1, valeur2):
   li=
   li=colonne.tolist()
   li.insert(position1,valeur1)
   li.insert(position2, valeur2)
   return li
Data_mois_area= insert(F.mois,0,12,'Janvier','Décembre')
Data_conso_area= insert(F.Pui_Conso,0,13,0,0)
Data_pv_area= insert(F.Pui_PV,0,13,0,0)
p = figure(x_range=mois, plot_height=500,
plot_width=800,toolbar_location=None,tools="hover")
xa=range(len(F.mois))
r0=p.patch(x=Data_mois_area, y=Data_conso_area, color="#003BFB")
r1=p.patch(x=Data_mois_area, y=Data_pv_area, color="#FBB000")
p.vbar_stack(['Pui_Autocon','Pui_Réinj'], x='mois', width=0.5,
color=colors,line_width=1, line_color='black',
        legend=['Autoconsommation','Réinjection'], source=source)
r3=p.circle(x='mois', y='Taux_autocon', size=10, color="red",
y_range_name="foo", source=source )
r4=p.circle(x='mois', y='Taux_autopro', size=10, color="purple",
y_range_name="foo", source=source)
p.y_range.start = 0
p.x_range.range_padding = 0.1
p.xgrid.grid_line_color = None
p.axis.minor_tick_line_color = None
p.outline_line_color = None
p.title.text = "Besoins et Consommation"
p.title.align = "center"
p.title.text_color = "black"
p.title.text_font_size = "15px"
p.xaxis.major_label_orientation = pi/4
p.yaxis.major_label_orientation = "horizontal"
p.yaxis.axis_label = "Energie en kWh"
p.yaxis.axis_label_text_font_style = "italic"
p.extra_y_ranges['foo'] = Range1d(0, 1.02)
p.add_layout(LinearAxis(y_range_name="foo"), 'right')
p.legend.orientation = "horizontal"
legend = Legend(items=[
("Consommation", [r0]),
("Production", [r1]),
("Taux autoconsommation", [r3]),
("Taux autoproduction ",[r4]),
], location=(1, -30))
p.add_layout(legend, 'right')}
show(p

--
You received this message because you are subscribed to the Google Groups "Bokeh Discussion - Public" group.
To unsubscribe from this group and stop receiving emails from it, send an email to [email protected].
To post to this group, send email to [email protected].
To view this discussion on the web visit https://groups.google.com/a/continuum.io/d/msgid/bokeh/747c1a9a-022d-4ad3-b639-7e762a0bf4fd%40continuum.io\.
For more options, visit https://groups.google.com/a/continuum.io/d/optout\.

--
You received this message because you are subscribed to the Google Groups "Bokeh Discussion - Public" group.
To unsubscribe from this group and stop receiving emails from it, send an email to [email protected].
To post to this group, send email to [email protected].
To view this discussion on the web visit https://groups.google.com/a/continuum.io/d/msgid/bokeh/ACA44085-0799-477C-A8BF-50B416512073%40anaconda.com\.
For more options, visit https://groups.google.com/a/continuum.io/d/optout\.