Plotting a line with an x offset works with categorical axes:
from bokeh.plotting import figure, show
from bokeh.io import output_notebook
output_notebook()
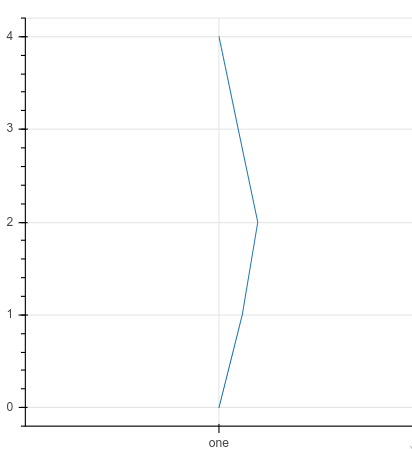
ys = list(range(5))
line_xs = [0, 0.06, 0.1, 0.05, 0]
cat_xs = ['one']
p = figure(width=400, height=400, x_range=cat_xs)
# p.circle([cat_xs[0]], 1)
p.line([(x, l) for x, l in zip(cat_xs * len(ys), line_xs)], ys)
show(p)
However, when trying it with a nested categorical, there is no output in the notebook, and the js console shows an error:
from bokeh.models import FactorRange
ys = list(range(5))
line_xs = [0, 0.06, 0.1, 0.05, 0]
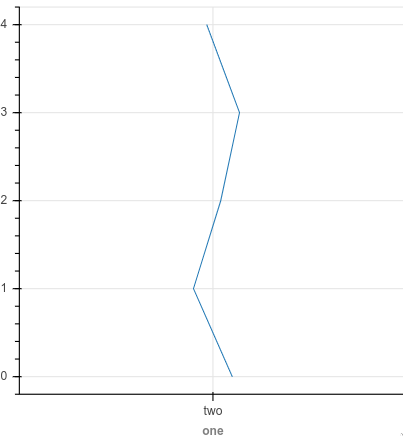
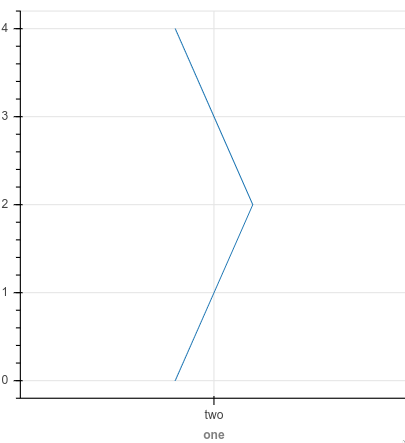
cat_xs = [('one', 'two')]
p = figure(width=400, height=400, x_range=FactorRange(*cat_xs))
# p.circle([cat_xs[0]], 1)
p.line([(x, l) for x, l in zip(cat_xs * len(ys), line_xs)], ys)
show(p)
VM2620:382 Uncaught TypeError: (intermediate value)(intermediate value)(intermediate value) is not iterable
    at _ (<anonymous>:382:2281)
    at _ (<anonymous>:382:2294)
    at Object.t.decode_column_data (<anonymous>:382:3285)
    at p.initialize (<anonymous>:355:1394)
    at p.finalize (<anonymous>:289:2698)
    at <anonymous>:276:6267
    at o (<anonymous>:276:6045)
    at o (<anonymous>:276:6037)
    at o (<anonymous>:276:6093)
    at o (<anonymous>:276:6037)
One way I found that works is to assume that the first category is at 0.5, and then give points around this, e.g. p.line([0.4, 0.5, 0.6, 0.5, 0.4], ys). Is this a safe assumption? Are bokeh categories always at 0.5, 1.5 etc? Or is there a better way to do this (probably)?
# Versions
-----
bokeh       2.0.2
sinfo       0.3.1
-----
IPython             7.13.0
jupyter_client      6.1.3
jupyter_core        4.6.3
jupyterlab          1.2.6
notebook            6.0.3
-----
Python 3.8.3 (default, May 19 2020, 18:47:26) [GCC 7.3.0]
Linux-4.15.0-101-generic-x86_64-with-glibc2.10