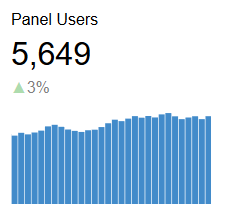
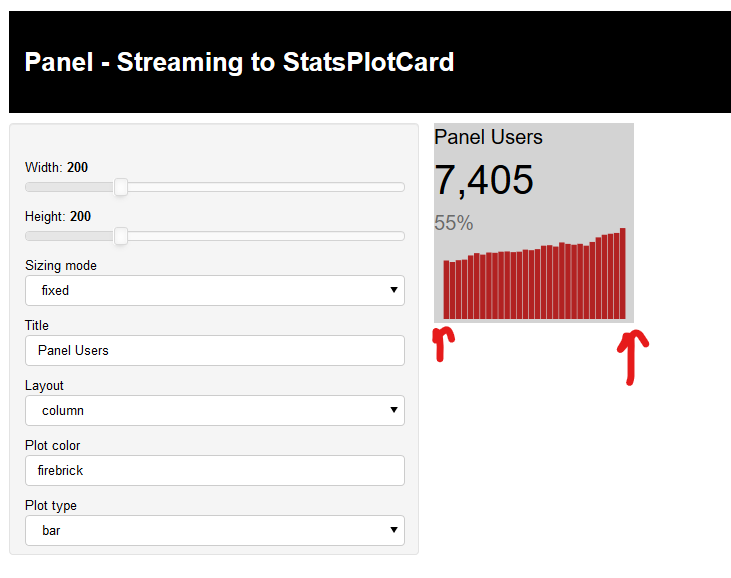
I’m working on a StatsPlotCard indicator widget PR for Panel developed as a custom Bokeh extensions. I’m trying to make this as efficient as possible for streaming use cases.
The problem I have now is that there is a bit of margin on the left and right sides of the plot.
Is it possible to remove? How?
private async setPlot() {
        this.plot = new Plot({
            toolbar_location: null,
            background_fill_color: null,
            border_fill_color: null,
            outline_line_color: null,
            min_border: 0,
            sizing_mode: "stretch_both"
        })
        var source = <ColumnDataSource>this.model.plot_data
        if (this.model.plot_type==="line"){
            var line = new Line({
                x: { field: this.model.plot_x },
                y: { field: this.model.plot_y },
                line_width: 6,
                line_color: this.model.plot_color,
            })
            this.plot.add_glyph(line, source)
        } else if (this.model.plot_type==="step"){
            var step = new Step({
                x: { field: this.model.plot_x },
                y: { field: this.model.plot_y },
                line_width: 6,
                line_color: this.model.plot_color,
            })
            this.plot.add_glyph(step, source)
        } else if (this.model.plot_type==="area") {
            var varea = new VArea({
                x: { field: this.model.plot_x },
                y1: { field: this.model.plot_y },
                y2: 0,
                fill_color: this.model.plot_color,
                fill_alpha: 0.5,
            })
            this.plot.add_glyph(varea, source)
            var line = new Line({
                x: { field: this.model.plot_x },
                y: { field: this.model.plot_y },
                line_width: 3,
                line_color: this.model.plot_color,
            })
            this.plot.add_glyph(line, source)
        } else {
            var vbar = new VBar({
                x: { field: this.model.plot_x },
                top: { field: this.model.plot_y },
                width: 0.9,
                line_color: null,
                fill_color: this.model.plot_color
            })
            this.plot.add_glyph(vbar, source)
        }

        // hover = p.select(dict(type=HoverTool))
        // hover.tooltips = [("x", "@x"), ("top", "@top"),]
        // hover.mode = 'mouse'
        const view = await build_view(this.plot)
        this.plotDiv.innerHTML=""
        view.renderTo(this.plotDiv)
    }
All the code of the PR can be found here.