Thanks both for replying! And thanks for the FuncTickFormatter tip! It is better than the PrintfTickFormatter I was using since it only shows significant digits instead of a fixed number of decimals. It still has the limitation that I need an if-statement to check if the numbers on the axes are large enough to apply the formatter, whereas the suggested formatter specifically for scientific notation would be applied automatically whenever scientific notation is used.
To be clear, I don’t want to push for this feature if it is unwanted, and for my purposes it works good enough with an if-statement and manually changing the labels. But I do think the current behavior is unexpected (might just be me) and unusual based on what I have seen elsewhere, so I’ll try to explain more why I think that way and give some examples from other libraries below.
Writing out numbers like 2.000e-300 is not great
Agree, but with smaller negative exponents the current Bokeh scientific formatting would actually be incorrect since it introduces precision that might not exist (e.g. it would make 0.2 appear as 2.000e-1, which is actually 0.200). This seems to not be an issue in practice since bokeh avoids applying scientific formatting to numbers in this range.
For large numbers in general, trailing zeros are not deemed that important with the current truncation either since you suppress 97 of them with typing 2.000e+100. To me, the logic behind writing 2e+100 instead, is the same as to why we write 2 instead of 2.000 (even if we had the original number at this higher precision). Those decimals are only important if the data varies over a very small range so that the next axis tick would be 2.125 or similar. This same logic is already applied in bokeh when formatting decimal numbers, and trailing zeros are truncated here.
Alternatively, if you have an example of default behaviors in other scientific plotting tools like MATLAB or matplotlib where bokeh behaves differently, it might compel more discussion about how the behavior can be integrated to bokeh to make it more friendly to new users.
You made me curious so I went looking into more libraries =) I tried to find the default behavior, but as I am not proficient in all these language, I might have misunderstood something. In any case, this is what I found (spoiler: none of the libraries I looked at include trailing zeros):
Matplotlib shows only significant digits follows by x 10^e (same example as linked above)
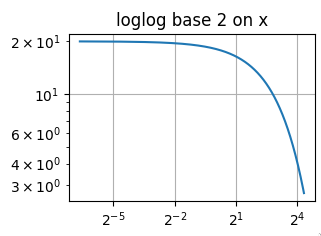
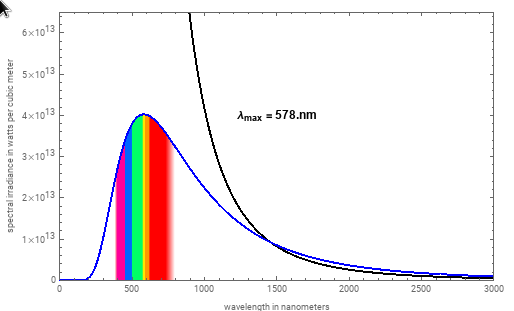
Mathematica is the same as matplotlib
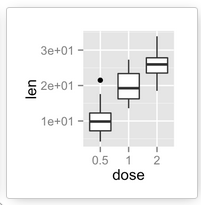
ggplot is similar, just using different notation for the exponent part
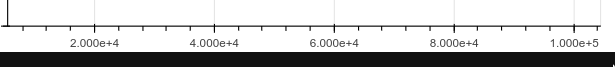
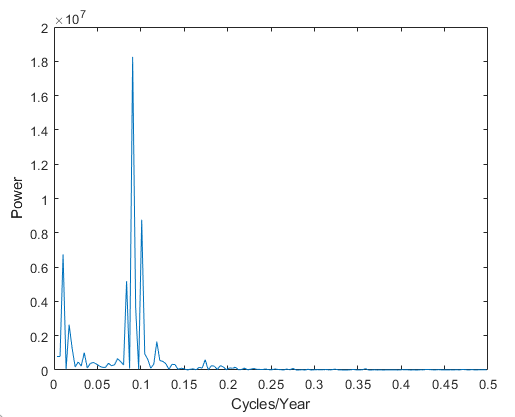
Matlab keeps only significant digits and includes the exponent at the top of the graph.
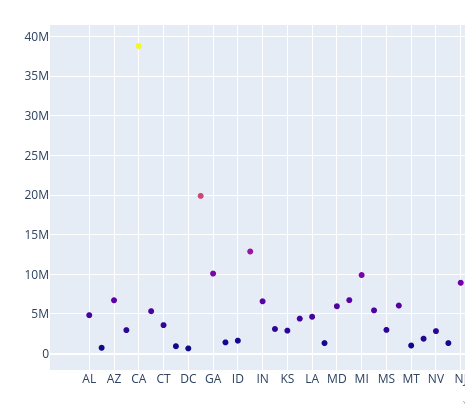
Plotly keeps only significant digits and abbreviates by letter suffix instead of exponent.
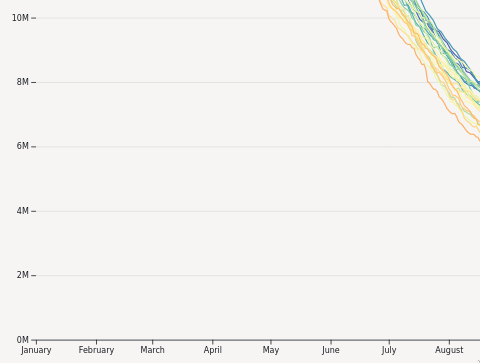
I believe D3 does the same as plotly (but I am not knowledgeable enough to say if that’s the default or if it is explicitly set somewhere in this example)
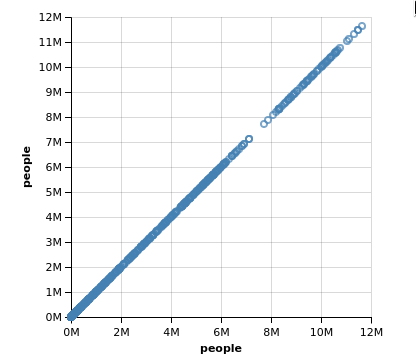
While vega/vega-lite/altair seems to alsways show the raw numbers, but their data exploratory tool polestar has the same behavior as plotly and d3.
Sorry that this post became so long.