I’m working on a cluster scatter plot where each cluster has it’s own color. How do I color code each cluster on a scatter plot? I believe there is a trick with ColumnDataSource and and/or factor_cmap but I’m having trouble following along on the docs. Here’s the full code:
import numpy as np
import pandas as pd
import random

from typing import List, Tuple
from bokeh.models import ColumnDataSource, Slider, Div, Select
from bokeh.sampledata.iris import flowers
from bokeh.plotting import figure, curdoc
from bokeh.layouts import column, row
from bokeh.palettes import Spectral10
from bokeh.transform import factor_cmap
# Use these centroids in the first iteration of you algorithm if "Random Centroids" is set to False in the Dashboard
DEFAULT_CENTROIDS = np.array([[5.664705882352942, 3.0352941176470587, 3.3352941176470585, 1.0176470588235293],
                              [5.446153846153847, 3.2538461538461543, 2.9538461538461536, 0.8846153846153846],
                              [5.906666666666667, 2.933333333333333, 4.1000000000000005, 1.3866666666666667],
                              [5.992307692307692, 3.0230769230769234, 4.076923076923077, 1.3461538461538463],
                              [5.747619047619048, 3.0714285714285716, 3.6238095238095243, 1.1380952380952383],
                              [6.161538461538462, 3.030769230769231, 4.484615384615385, 1.5307692307692309],
                              [6.294117647058823, 2.9764705882352938, 4.494117647058823, 1.4],
                              [5.853846153846154, 3.215384615384615, 3.730769230769231, 1.2076923076923078],
                              [5.52857142857143, 3.142857142857143, 3.107142857142857, 1.007142857142857],
                              [5.828571428571429, 2.9357142857142855, 3.664285714285714, 1.1]])
def get_closest(data_point: np.ndarray, centroids: np.ndarray):
    """
    Takes a data_point and a nd.array of multiple centroids and returns the index of the centroid closest to data_point
    by computing the euclidean distance for each centroid and picking the closest.
    """
    N = centroids.shape[0]
    dist = np.empty(N)
    for i, c in enumerate(centroids):
        dist[i] = np.linalg.norm(c - data_point)
    index_min = np.argmin(dist)
    return index_min

def to_classes(clustering):
    # Get number of samples (you can pass it directly to the function)
    num_samples = sum(x.shape[0] for x in clustering)
    indices = np.empty((num_samples,))  # An empty array with correct size
    for ith, cluster in enumerate(clustering):
        # use cluster indices to assign to correct the cluster index
        indices[cluster] = ith
    return indices.astype(int)
def k_means(data_np: np.ndarray, k:int=3, n_iter:int=500, random_initialization=False) -> Tuple[np.ndarray, int]:
    """
    :param data: your data, a numpy array with shape (n_entries, n_features)
    :param k: The number of clusters to compute
    :param n_iter: The maximal numnber of iterations
    :param random_initialization: If False, DEFAULT_CENTROIDS are used as the centroids of the first iteration.

    :return: A tuple (cluster_indices: A numpy array of cluster_indices,
                      n_iterations: the number of iterations it took until the algorithm terminated)
    """
    # Initialize the algorithm by assigning random cluster labels to each entry in your dataset
    k=k+1
    centroids = data_np[random.sample(range(len(data_np)), k)]
    labels = np.array([np.argmin([(el - c) ** 2 for c in centroids]) for el in data_np])
    clustering = []
    for k in range(k):
        clustering.append(data_np[labels == k])

    # Implement K-Means with a while loop, which terminates either if the centroids don't move anymore, or
    # if the number of iterations exceeds n_iter
    counter = 0
    while counter < n_iter:
        # Compute the new centroids, if random_initialization is false use DEFAULT_CENTROIDS in the first iteration
        # if you use DEFAULT_CENTROIDS, make sure to only pick the k first entries from them.
        if random_initialization is False and counter == 0:
            centroids = DEFAULT_CENTROIDS[random.sample(range(len(DEFAULT_CENTROIDS)), k)]

        # Update the cluster labels using get_closest
        labels = np.array([get_closest(el, centroids) for el in data_np])
        clustering = []
        for i in range(k):
            clustering.append(np.where(labels == i)[0])

        counter += 1

        new_centroids = np.zeros_like(centroids)
        for i in range(k):
            if len(clustering[i]) > 0:
                new_centroids[i] = data_np[clustering[i]].mean(axis=0)
            else:
                new_centroids[i] = centroids[i]

        # if the centroids didn't move, exit the while loop
        if clustering is not None and (centroids != new_centroids).sum() == 0:
            break
        else:
            centroids = new_centroids
        pass

    # return the final cluster labels and the number of iterations it took
    clustering = to_classes(clustering)
    return clustering, counter
Note: The callback is still a work in progress and it will be the last thing I work on. Just ignore it for now.
def callback(attr, old, new):
    # recompute the clustering and update the colors of the data points based on the result
    k = slider_k.valued_throttled
    init = select_init.value
    clustering_new, counter_new = k_means(data_np,k,500,init)
    pass
# read and store the dataset
data: pd.DataFrame = flowers.copy(deep=True)
data = data.drop(['species'], axis=1)
This is where I create my ColumnDataSource
# Create a copy of the data as numpy array, which you can use for computing the clustering
data_np = np.asarray(data)

# Create the dashboard
# 1. A Select widget to choose between random initialization or using the DEFAULT_CENTROIDS on top
select_init = Select(title='Random Centroids',value='False',options=['True','False'])

# 2. A Slider to choose a k between 2 and 10 (k being the number of clusters)
slider_k = Slider(start=2,end=10,value=3,step=1,title='k')

# 4. Connect both widgets to the callback
select_init.on_change('value',callback)
slider_k.on_change('value_throttled',callback)

# 3. A ColumnDataSource to hold the data and the color of each point you need
clustering, counter = k_means(data_np,4,500,False)
source = ColumnDataSource(dict(petal_length=data['petal_length'],sepal_length=data['sepal_length'],petal_width=data['petal_width'],clustering=clustering))
This is where I create the plots and where I’m also stuck with factor_cmap()
# 4. Two plots displaying the dataset based on the following table, have a look at the images
# in the handout if this confuses you.
#
#       Axis/Plot	Plot1 	Plot2
#       X	Petal length 	Petal width
#       Y	Sepal length	Petal length
#
# Use a categorical color mapping, such as Spectral10, have a look at this section of the bokeh docs:
# https://docs.bokeh.org/en/latest/docs/user_guide/categorical.html#filling
plot1 = figure(plot_width=100,plot_height=100,title='Scatterplot of flowers distribution by petal length and sepal length')
plot1.yaxis.axis_label = 'Sepal length'
plot1.xaxis.axis_label = 'Petal length'
scatter1 = plot1.scatter(x='petal_length',y='sepal_length',source=source,fill_color=factor_cmap('clustering', palette=Spectral10, factors=clustering))

plot2 = figure(plot_width=100,plot_height=100,title='Scatterplot of flowers distribution by petal width and petal length')
plot2.yaxis.axis_label = 'Petal length'
plot2.xaxis.axis_label = 'Petal width'
scatter2 = plot2.scatter(x='petal_width',y='petal_length',source=source,fill_color=factor_cmap('clustering', palette=Spectral10, factors=clustering))

# 5. A Div displaying the currently number of iterations it took the algorithm to update the plot.
div = Div(text='Number of iterations: ', counter)
lt = row(column[select_init,slider_k,div],plot1,plot2)

curdoc().add_root(lt)
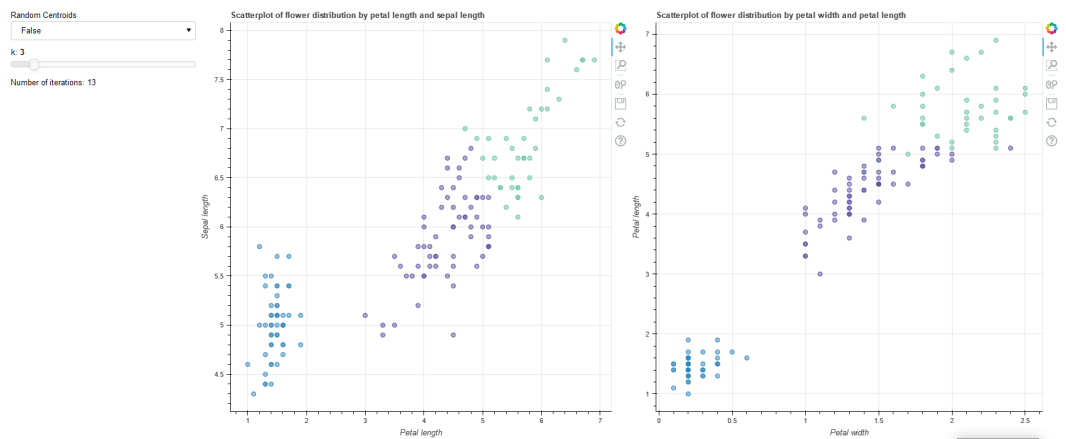
And so the final plot should like so
>cd file_path
>bokeh serve --show file_name.py
This is my current error:
---------------------------------------------------------------------------
ValueError                                Traceback (most recent call last)
<ipython-input-7-4f7e5f657af0> in <module>
     24 plot1.yaxis.axis_label = 'Sepal length'
     25 plot1.xaxis.axis_label = 'Petal length'
---> 26 scatter1 = plot1.scatter(x='petal_length',y='sepal_length',source=source,fill_color=factor_cmap('clustering', palette=Spectral10, factors=clustering))
     27
     28 plot2 = figure(plot_width=100,plot_height=100,title='Scatterplot of flowers distribution by petal width and petal length')

~\Anaconda3\lib\site-packages\bokeh\transform.py in factor_cmap(field_name, palette, factors, start, end, nan_color)
    119
    120     '''
--> 121     return field(field_name, CategoricalColorMapper(palette=palette,
    122                                                     factors=factors,
    123                                                     start=start,

~\Anaconda3\lib\site-packages\bokeh\models\mappers.py in __init__(self, palette, **kwargs)
     93         if palette is not None:
     94             kwargs['palette'] = palette
---> 95         super().__init__(**kwargs)
     96
     97 @abstract

~\Anaconda3\lib\site-packages\bokeh\model.py in __init__(self, **kwargs)
    234         kwargs.pop("id", None)
    235
--> 236         super().__init__(**kwargs)
    237         default_theme.apply_to_model(self)
    238

~\Anaconda3\lib\site-packages\bokeh\core\has_props.py in __init__(self, **properties)
    267
    268         for name, value in properties.items():
--> 269             setattr(self, name, value)
    270
    271         self._initialized = True

~\Anaconda3\lib\site-packages\bokeh\core\has_props.py in __setattr__(self, name, value)
    296
    297         if name in props or (descriptor is not None and descriptor.fset is not None):
--> 298             super().__setattr__(name, value)
    299         else:
    300             matches, text = difflib.get_close_matches(name.lower(), props), "similar"

~\Anaconda3\lib\site-packages\bokeh\core\property\descriptors.py in __set__(self, obj, value, setter)
    550             raise RuntimeError(f"{class_name}.{self.name} is a readonly property")
    551
--> 552         self._internal_set(obj, value, setter=setter)
    553
    554     def __delete__(self, obj):

~\Anaconda3\lib\site-packages\bokeh\core\property\descriptors.py in _internal_set(self, obj, value, hint, setter)
    782
    783         """
--> 784         value = self.property.prepare_value(obj, self.name, value)
    785         old = self._get(obj)
    786         self._real_set(obj, old, value, hint=hint, setter=setter)

~\Anaconda3\lib\site-packages\bokeh\core\property\bases.py in prepare_value(self, owner, name, value)
    348         else:
    349             obj_repr = owner if isinstance(owner, HasProps) else owner.__name__
--> 350             raise ValueError(f"failed to validate {obj_repr}.{name}: {error}")
    351
    352         if isinstance(owner, HasProps):

ValueError: failed to validate CategoricalColorMapper(id='1038', ...).factors: expected an element of either Seq(String), Seq(Tuple(String, String)) or Seq(Tuple(String, String, String)), got array([3, 3, 3, 3, 3, 3, 3, 3, 3, 3, 3, 3, 3, 3, 3, 3, 3, 3, 3, 3, 3, 3,
       3, 3, 3, 3, 3, 3, 3, 3, 3, 3, 3, 3, 3, 3, 3, 3, 3, 3, 3, 3, 3, 3,
       3, 3, 3, 3, 3, 3, 0, 0, 0, 2, 0, 2, 0, 2, 0, 2, 2, 2, 2, 0, 2, 0,
       0, 2, 0, 2, 0, 2, 0, 0, 0, 0, 0, 0, 0, 2, 2, 2, 2, 0, 2, 0, 0, 0,
       2, 2, 2, 0, 2, 2, 2, 2, 2, 0, 2, 2, 1, 0, 1, 1, 1, 1, 2, 1, 1, 1,
       0, 0, 1, 0, 0, 1, 1, 1, 1, 0, 1, 0, 1, 0, 1, 1, 0, 0, 1, 1, 1, 1,
       1, 0, 0, 1, 1, 1, 0, 1, 1, 1, 0, 1, 1, 1, 0, 0, 1, 0])