I have started to create a statscard as bokeh extension.
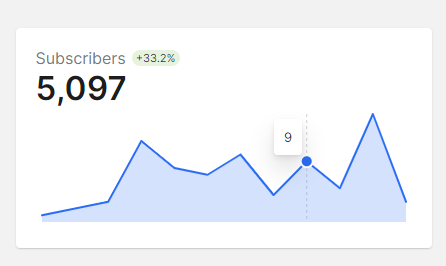
The goal is to be able to efficiently stream to maybe 50 of these in a page using Bokeh/ Panel.
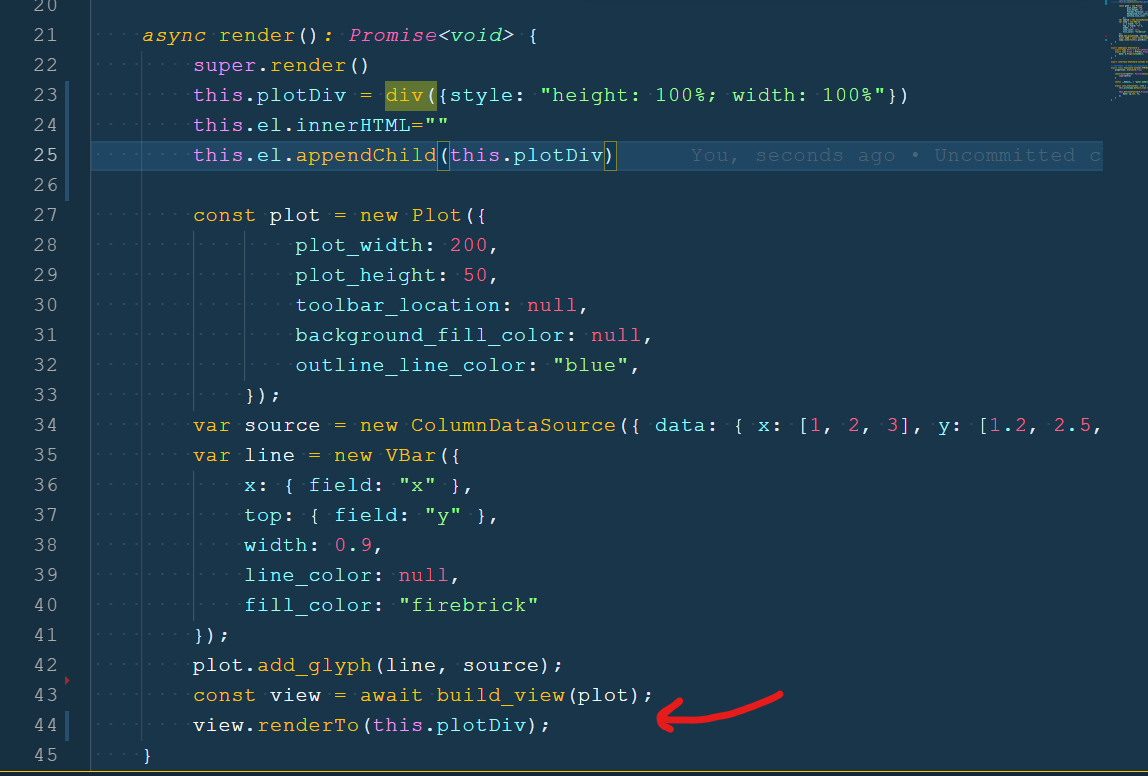
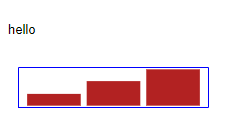
I’m now stuck because I don’t know how I can “add” a plot like below. I’ve really tried searching the bokeh docs, bokeh discourse, Bokeh github and just google. But without luck.
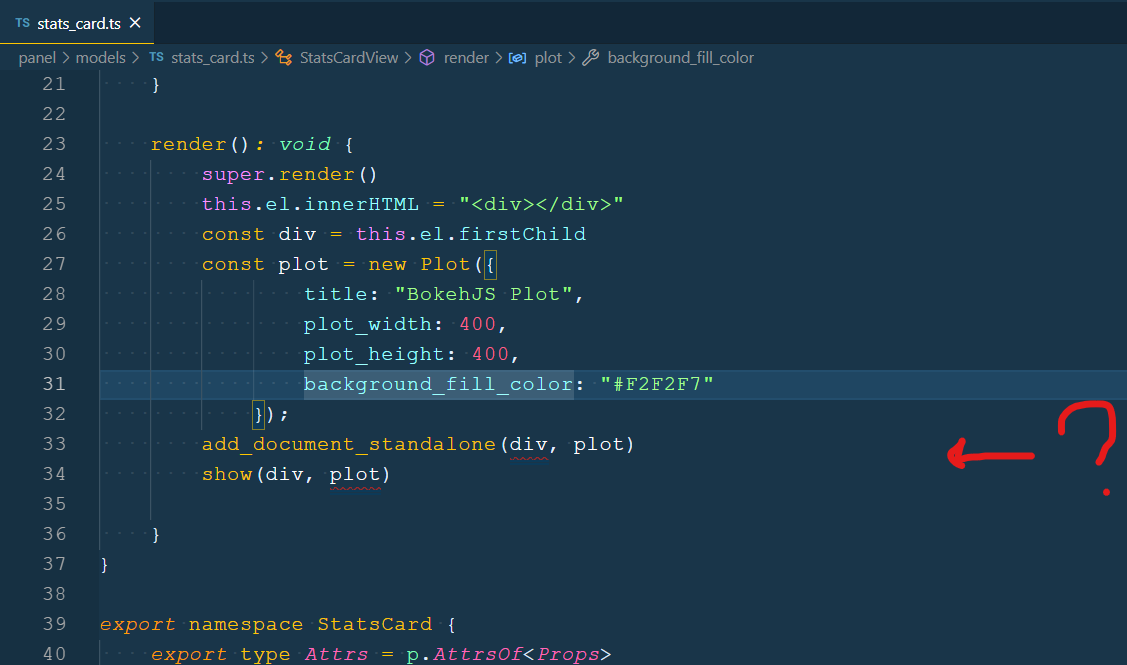
I would be grateful if I could be pointed in the right direction with a small snippet of code or a link to a working example. Thanks.
// See https://docs.bokeh.org/en/latest/docs/reference/models/layouts.html
import { HTMLBox, HTMLBoxView } from "@bokehjs/models/layouts/html_box"
import { Plot } from "@bokehjs/models/plots/plot"
import { add_document_standalone } from "@bokehjs/embed"

// See https://docs.bokeh.org/en/latest/docs/reference/core/properties.html
import * as p from "@bokehjs/core/properties"

// The view of the Bokeh extension/ HTML element
// Here you can define how to render the model as well as react to model changes or View events.
export class StatsCardView extends HTMLBoxView {
    model: StatsCard

    connect_signals(): void {
        super.connect_signals()

        this.connect(this.model.properties.data.change, () => {
            this.render();
        })
    }

    render(): void {
        super.render()
        this.el.innerHTML = "<div></div>"
        const div = this.el.firstChild
        const plot = new Plot({
                title: "BokehJS Plot",
                plot_width: 400,
                plot_height: 400,
                background_fill_color: "#F2F2F7"
            });
        add_document_standalone(div, plot)
        show(div, plot)

    }
}

export namespace StatsCard {
    export type Attrs = p.AttrsOf<Props>
    export type Props = HTMLBox.Props & {
        data: p.Property<number>,
    }
}

export interface StatsCard extends StatsCard.Attrs { }

// The Bokeh .ts model corresponding to the Bokeh .py model
export class StatsCard extends HTMLBox {
    properties: StatsCard.Props

    constructor(attrs?: Partial<StatsCard.Attrs>) {
        super(attrs)
    }

    static __module__ = "panel.models.stats_card"

    static init_StatsCard(): void {
        this.prototype.default_view = StatsCardView;

        this.define<StatsCard.Props>({
            data: [p.Int, 0],
        })
    }
}