Hi there…
I’m trying to render a chart, which is based on a model object on my django.models file.
I tried the following on my get() function:
def get(self, request):
retrive=HistoricalData.objects.all()
get_symbol=retrive.filter(instrument__symbol="BTUSD").order_by('datetime')
fields=get_symbol.values('datetime','opening_price','closing_price','min_price','max_price','volume')
df=pd.DataFrame.from_records(fields)
source = ColumnDataSource(data=df)
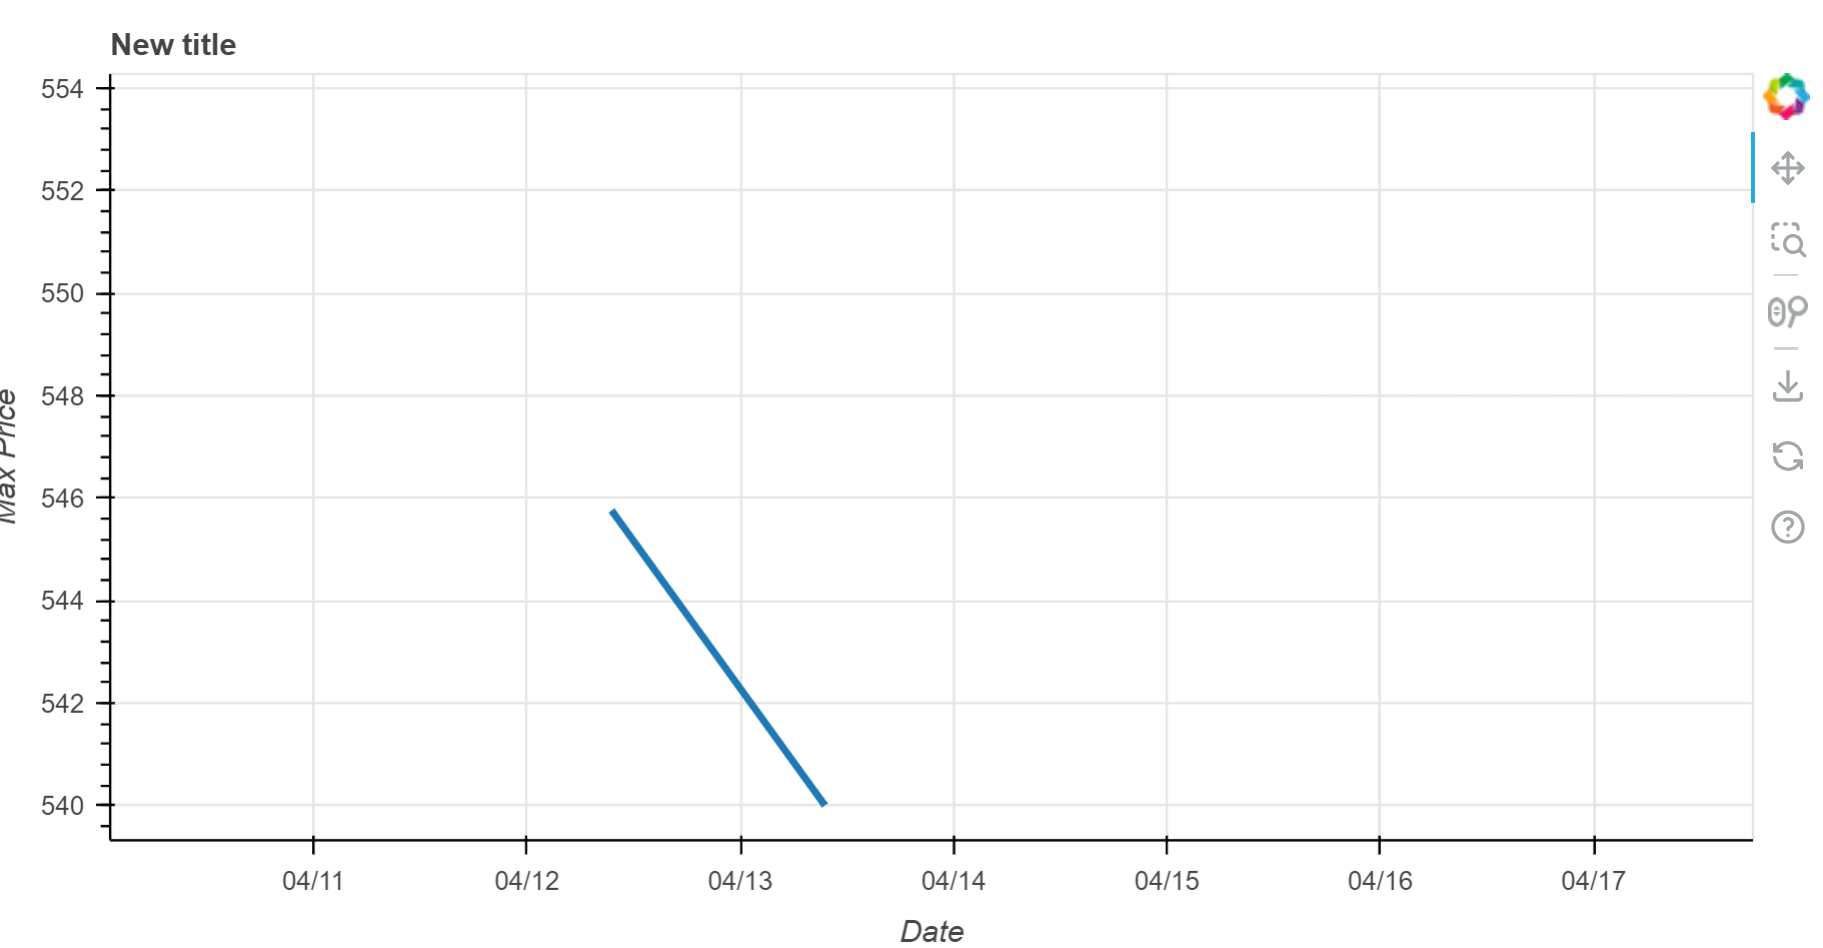
plot = figure(title="New title", width=780, height=400,
x_axis_label="Date", y_axis_label="Max Price", x_axis_type="datetime")
plot.line(x='datetime', y='opening_price', source=source, line_width=3)
#Tried to implement the line that follows from the documentation example, but it does not work for me.
plot.xaxis.major_label_overrides = {i: date.strftime('%b %d') for i, date in zip(df.index, df["datetime"])}
plot.xaxis.ticker = list(range(df.index[0], df.index[-1], 5))
plot.toolbar.autohide = True
script, div = components(plot)
if user.is_authenticated:
return render(request,self.template_name, {'form':form,'days_of_month': [i for i in range(1,32)],
'script':script, 'div':div,
})
return redirect('home')
You can find a more complete code here: django - Bokeh, how do i remove datetimes without corresponding values? - Stack Overflow
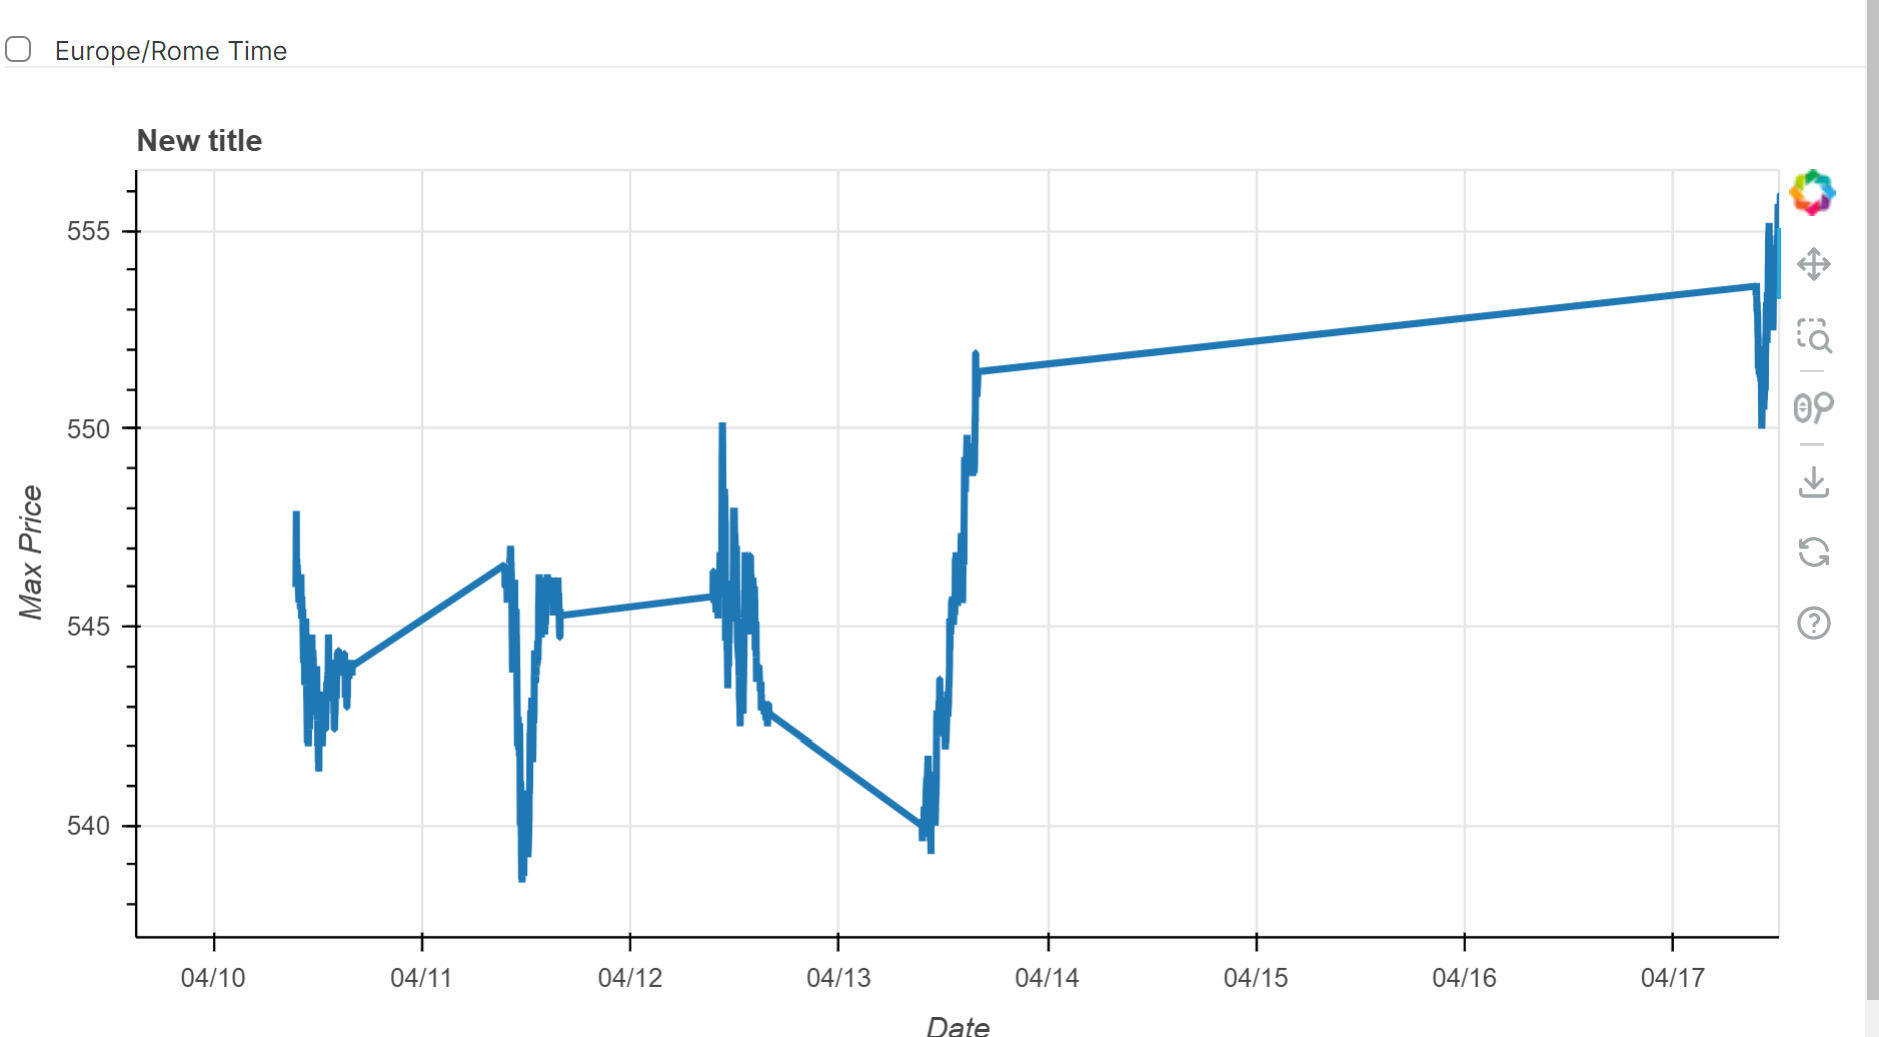
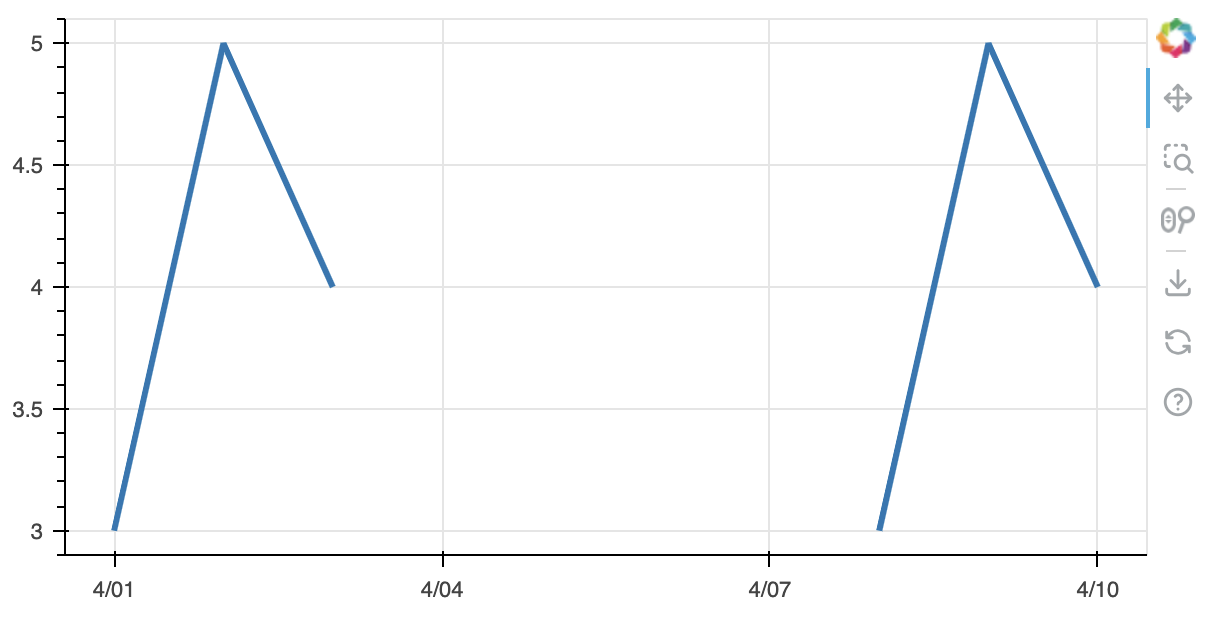
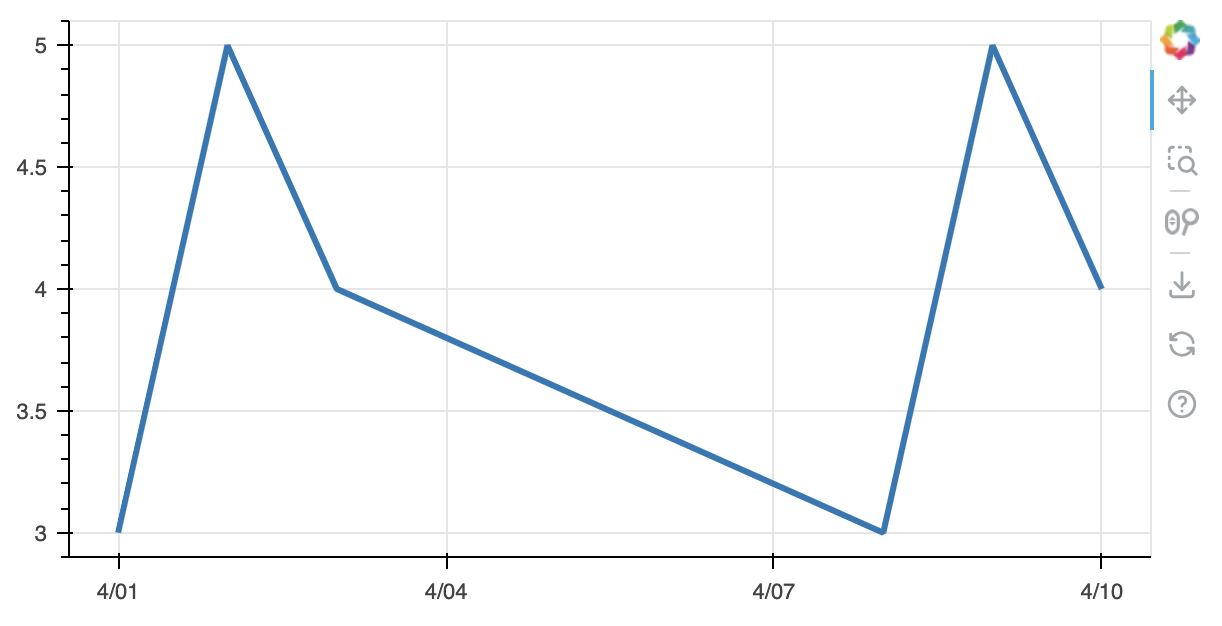
This is the final result, you can see those long lines in blue on the chart, they are here because there are some days that are not present in my database, the days that the market is closed, and the Bokeh chart understands that it needs to render these days anyway because i pass the data of the x axis as ‘datetime’ data.
Note that i already tried to turn the ‘datetime’ field into a String column using the line:
df[‘datetime’] = df[‘datetime’].astype(str)
But it does not work, it shows an empty chart.
I need you guys to suggest me an approach for example, of turning my ‘x’ axis into a string axis, so that my data renders without those empty days.
Thank you in advance.