Hello!
I noticed that your question is very similar to this one. The answerer recommends a clever use of ‘major_label_overrides’. I’ve tried to replicate your code as faithfully as I can to include this:
import datetime
from bokeh.models import ColumnDataSource, FactorRange, HoverTool
from bokeh.plotting import figure, output_notebook, show
import pandas as pd

dataframe = pd.read_csv("sample.csv")

if dataframe['VOLUME'].max() >= 100000:
    dataframe["VOLUME"] = dataframe["VOLUME"].__div__(100)
else:
    dataframe["VOLUME"] = dataframe["VOLUME"]

dataframe['DATE'] = pd.to_datetime(dataframe['DATE'])

dataframe['index1'] = dataframe.index

p = ColumnDataSource(dataframe)

ts2 = figure(sizing_mode='stretch_both',x_axis_type='datetime', active_drag="auto",
   x_axis_label='DATE', y_axis_label='VOLUME')

ts2.xaxis.major_label_overrides = {
    i: date.strftime('%b %d') for i, date in enumerate(pd.to_datetime(dataframe["DATE"]))
}

t1 = ts2.vbar(x ='index1', top= 'VOLUME',width = 1, bottom = 0,  legend='volume',
           color='red', source=p)

ts2.grid.grid_line_alpha = 0.8

ts2.add_tools(HoverTool(renderers=[t1],
                tooltips=[("Date", "@DATE{%F}"), ("Volume", "@VOLUME{0.2f}")],
                formatters={"DATE": "datetime"},
                mode='vline'))
And I got this:
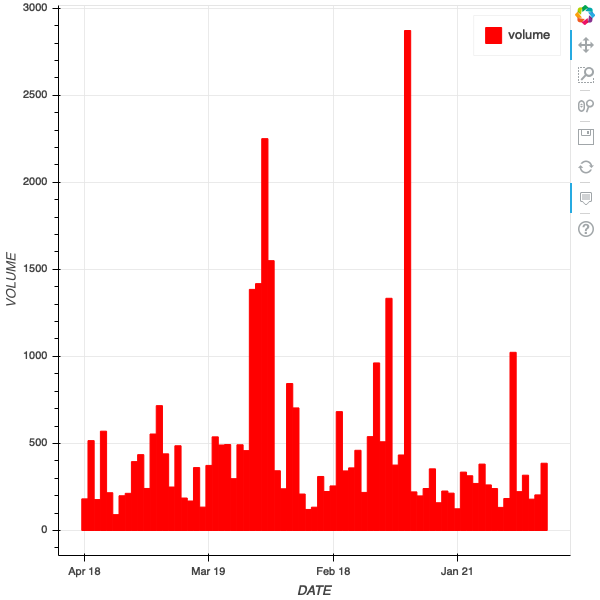
Is that what you’re looking for?
Let me know if this is unclear!
Alexandre