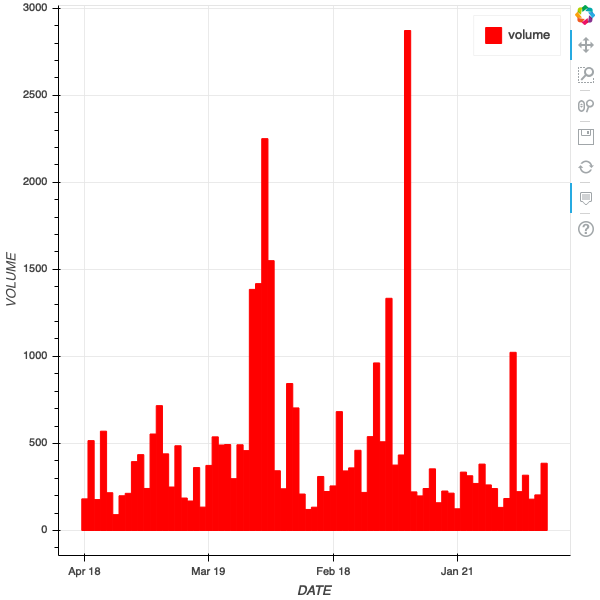
Hello everyone, I have created below graph, but there are gaps for missing dates over x-axis in below image. How i can omit those gaps.
You can get required data from given link [[https://github.com/internshipdeco/sample_data ]] and code as below,
from bokeh.io import show, output_file, curdoc
import dateutil
from bokeh.models import HoverTool
import pandas as pd
import pymongo
import datetime
from bokeh.models import ColumnDataSource, FactorRange
from bokeh.plotting import figure
dataframe = pd.read_csv("sample.csv")
#some preprocessing
if dataframe['VOLUME'].max() >= 100000:
   dataframe["VOLUME"] = dataframe["VOLUME"].__div__(100)
else:
   dataframe["VOLUME"] = dataframe["VOLUME"]
 dataframe['DATE'] = pd.to_datetime(dataframe['DATE'])
 p = ColumnDataSource(data=dict(DATE=[], VOLUME=[]))
 p.data = p.from_df(dataframe)

ts2 = figure(sizing_mode='stretch_both', x_axis_type='datetime', active_drag="auto",
       x_axis_label='DATE', y_axis_label='VOLUME')
t1 = ts2.vbar(x ='DATE', top= 'VOLUME',width = 1, bottom = 0,  legend='volume',
           color='red', source=p)
ts2.grid.grid_line_alpha = 0.8
ts2.add_tools(HoverTool(renderers=[t1],
                tooltips=[("Date", "@DATE{%F}"), ("Volume", "@VOLUME{0.2f}")],
                formatters={"DATE": "datetime"},
                mode='vline'))
#ts2.add_tools(hover_tool)

ts2.x_range.start = dataframe.DATE.min().timestamp() * 1000
ts2.x_range.end = dataframe.DATE.max().timestamp() * 1000
curdoc().add_root(ts2)
Thank you